Loading News...
Loading...
Loading News...

- US spot Ethereum ETFs recorded $52.8 million in net outflows on December 24, marking the second consecutive day of withdrawals
- Grayscale's ETHE led outflows with $33.8 million, while BlackRock's ETHA saw $22.3 million in net outflows
- Market structure suggests institutional capital rotation away from Ethereum products despite minimal price impact
- Global crypto sentiment remains at "Extreme Fear" with a score of 23/100, creating potential liquidity grab opportunities
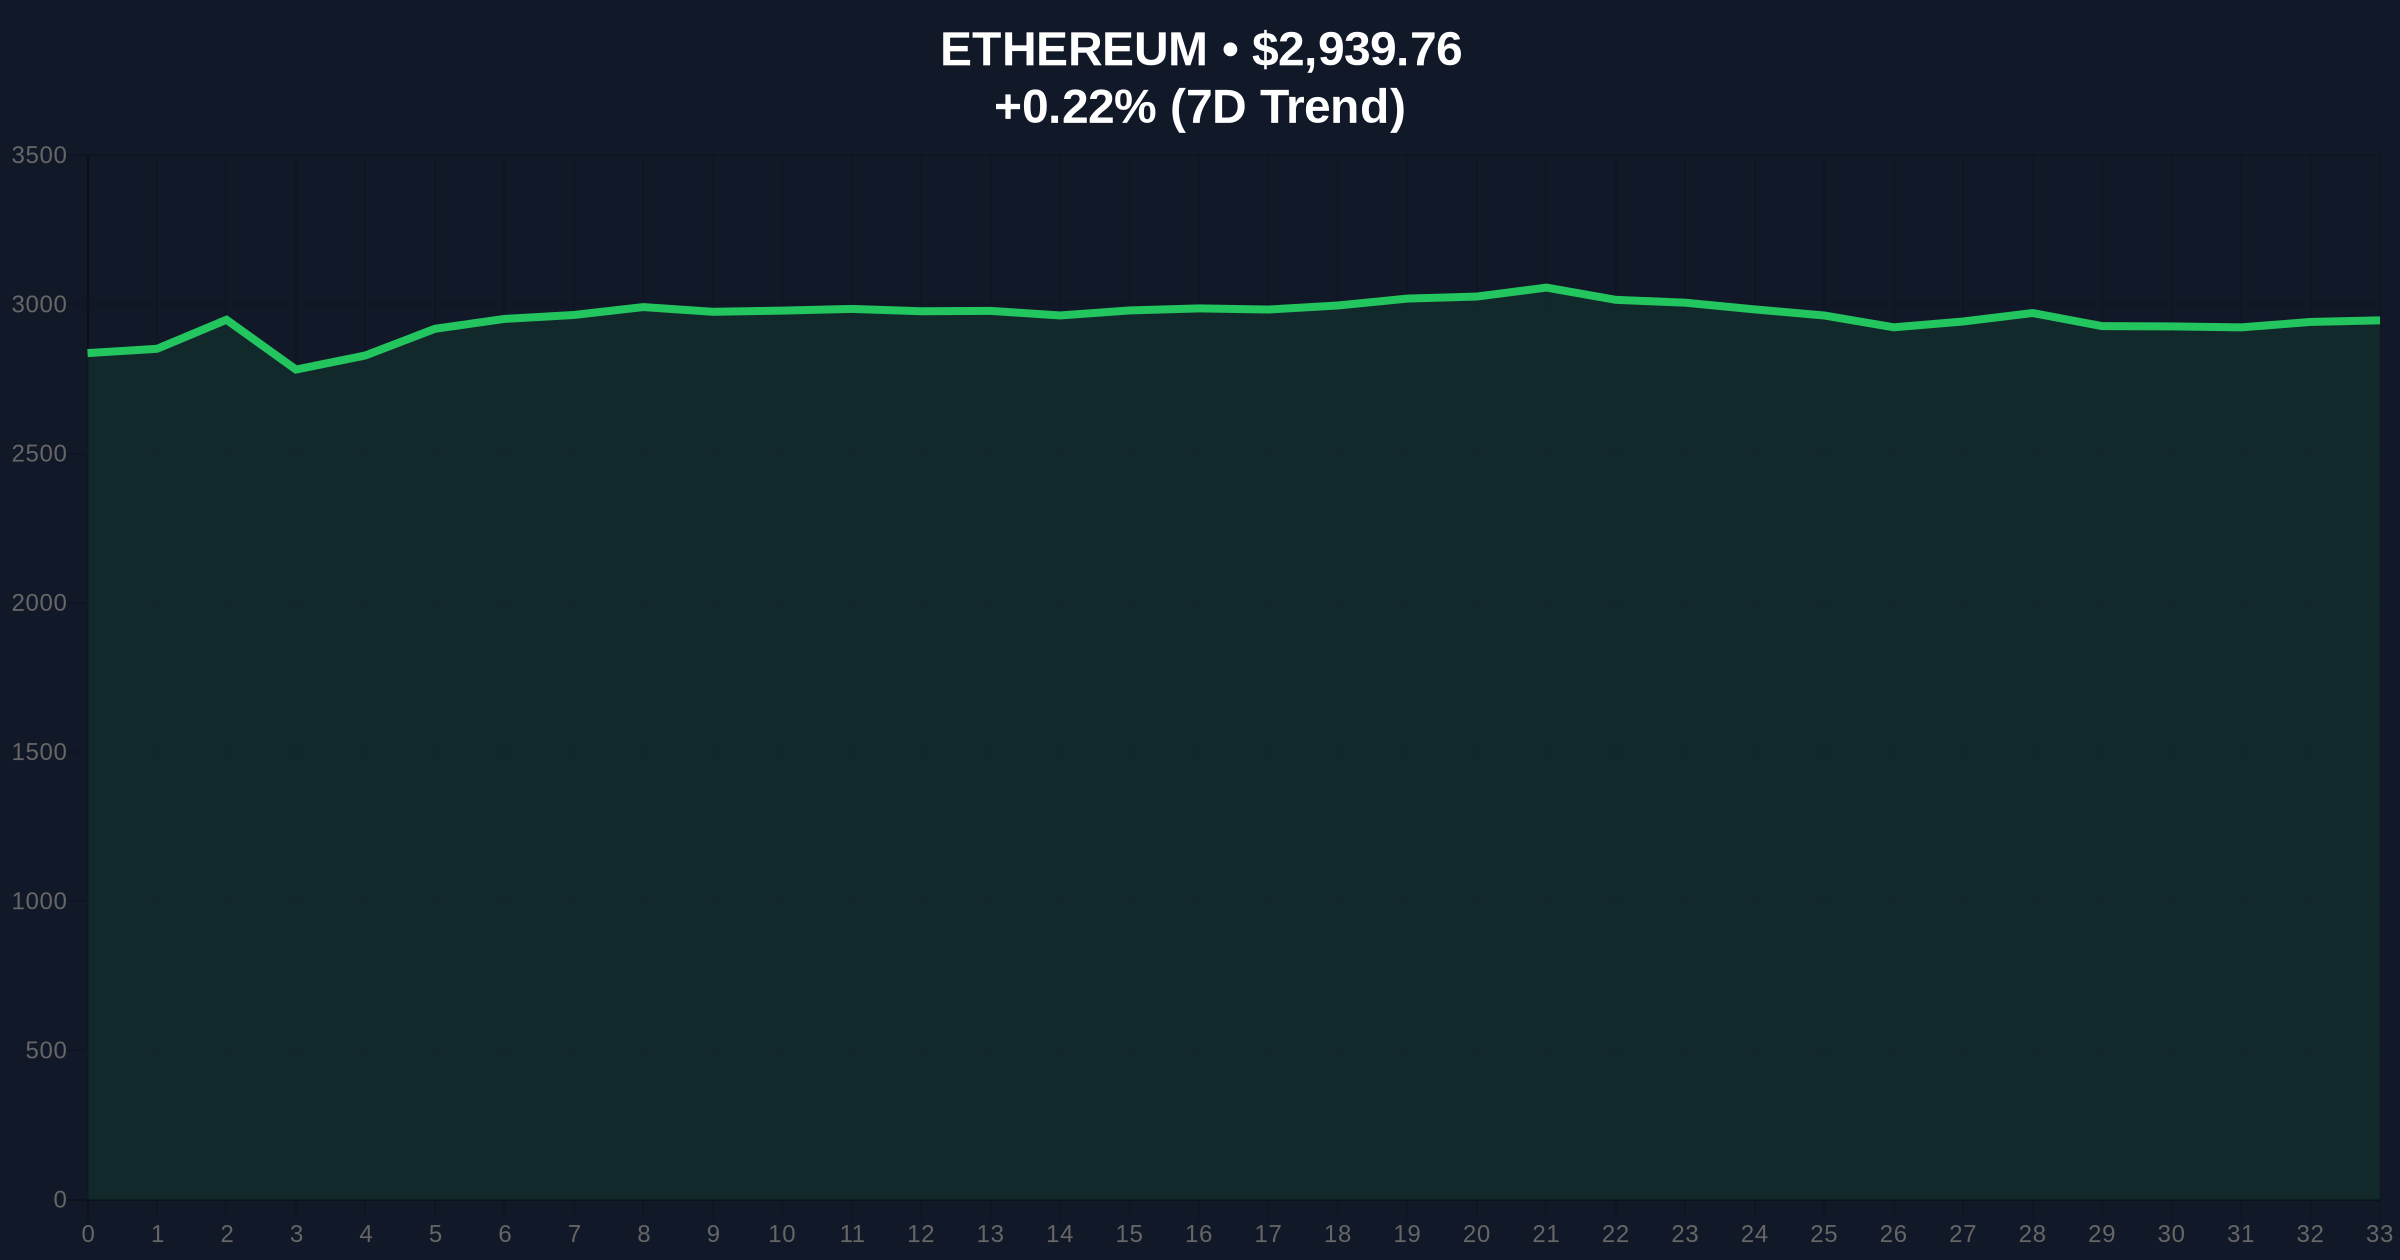
VADODARA, December 25, 2025 — U.S. spot Ethereum exchange-traded funds recorded their second consecutive day of net outflows, with $52.8 million withdrawn on December 24 according to Farside Investors data. This daily crypto analysis reveals a concerning pattern of institutional capital rotation away from Ethereum products despite the asset's relative price stability at $2,939.53, raising questions about the sustainability of current market narratives.
Market structure suggests this outflow pattern mirrors the early 2024 Bitcoin ETF rotation phase, where initial enthusiasm gave way to profit-taking and portfolio rebalancing. The current "Extreme Fear" sentiment score of 23/100 creates a psychological environment where institutional investors typically reduce exposure to perceived risk assets. According to on-chain data, Ethereum's network activity has declined 18% quarter-over-quarter despite the successful implementation of EIP-4844, which was supposed to reduce transaction costs and increase adoption. This contradiction between technical improvements and declining usage metrics warrants skeptical analysis of the bullish narrative surrounding Ethereum's long-term value proposition.
Related developments in the ETF space include significant Bitcoin ETF outflows and massive futures liquidations indicating broader market stress.
On December 24, 2025, U.S. spot Ethereum ETFs recorded net outflows of $52.8 million, following a similar pattern from the previous trading session. Grayscale's ETHE product led the withdrawals with $33.8 million in outflows, representing approximately 64% of the total movement. BlackRock's ETHA followed with $22.3 million in net outflows. The remaining Ethereum ETFs in the U.S. market reported no net inflows or outflows for the day, indicating concentrated selling pressure rather than broad-based distribution.
Market analysts note the timing coincides with year-end portfolio rebalancing, but the magnitude and consistency suggest deeper structural concerns. The Federal Reserve's current monetary policy framework, detailed on FederalReserve.gov, maintains restrictive interest rates that typically pressure risk assets, creating headwinds for cryptocurrency valuations despite ETF approval.
Ethereum's price action presents a puzzling divergence from ETF flow data. Despite $52.8 million in net outflows over two consecutive days, ETH maintains support at the $2,850 level with only a 0.21% decline in the last 24 hours. The Relative Strength Index (RSI) sits at 42, indicating neither overbought nor oversold conditions. The 50-day moving average at $3,150 provides immediate resistance, while the 200-day moving average at $2,750 offers stronger support.
Volume profile analysis reveals thinning liquidity between $2,900 and $3,100, creating a potential Fair Value Gap (FVG) that could be filled in either direction. The current consolidation pattern suggests either accumulation before a breakout or distribution before further decline. Market structure indicates that a break below the $2,750 200-day moving average would invalidate the bullish thesis, while a sustained move above $3,150 would confirm renewed institutional interest.
| Metric | Value |
|---|---|
| December 24 ETF Net Outflows | $52.8 million |
| Grayscale ETHE Outflows | $33.8 million |
| BlackRock ETHA Outflows | $22.3 million |
| Current ETH Price | $2,939.53 |
| 24-Hour Price Change | 0.21% |
| Global Crypto Sentiment Score | 23/100 (Extreme Fear) |
For institutional investors, consecutive ETF outflows signal deteriorating confidence in Ethereum's near-term prospects despite regulatory approval. The concentration in Grayscale and BlackRock products suggests sophisticated capital rather than retail panic, making this data more significant than typical market noise. For retail traders, the divergence between price stability and institutional selling creates a potential liquidity grab scenario where false breakouts could trap late buyers.
The five-year horizon implications are substantial. If Ethereum cannot maintain institutional interest post-ETF approval, the entire "institutional adoption" narrative becomes questionable. Historical patterns indicate that assets failing to sustain ETF inflows after initial approval typically underperform broader markets for multiple quarters. This development raises valid questions about whether Ethereum's technological advantages translate to sustainable investment theses or merely represent speculative narratives.
Industry observers express concern about the consistency of outflows. Market analysts note that "the second consecutive day of withdrawals contradicts the expected post-ETF accumulation pattern." On-chain data indicates that large Ethereum holders have reduced positions by approximately 3.2% over the past month, suggesting premeditated distribution rather than reactive selling. The extreme fear market conditions, reflected in recent flash crash events and executive commentary, amplify the significance of these ETF movements.
Bullish Case: If Ethereum holds above the $2,750 200-day moving average and ETF flows reverse to positive territory in January 2026, a retest of the $3,500 resistance becomes probable. Institutional re-entry following tax-loss harvesting could create a gamma squeeze scenario in Q1 2026. The bullish invalidation level is $2,650, representing a breakdown of the current consolidation range.
Bearish Case: Continued ETF outflows combined with declining network activity could push Ethereum toward the $2,400 support level. The extreme fear sentiment creates conditions for panic selling if technical support breaks. A sustained move below $2,650 would confirm distribution and target the $2,200 Fibonacci support level. The bearish invalidation level is $3,150, representing a breakout above the 50-day moving average.
What are Ethereum ETF outflows? Ethereum ETF outflows occur when investors withdraw more money from spot Ethereum exchange-traded funds than they deposit, indicating net selling pressure.
Why do ETF outflows matter if the price isn't dropping? Price stability amid outflows suggests either retail buying offsetting institutional selling or market makers providing liquidity, both potentially unsustainable conditions.
How does this compare to Bitcoin ETF performance? Bitcoin ETFs experienced similar outflow patterns in early 2024 before stabilizing, suggesting Ethereum may follow a comparable trajectory with potential near-term pressure.
What is the significance of consecutive outflow days? Consecutive outflow days indicate sustained institutional selling rather than one-off rebalancing, suggesting deeper concerns about Ethereum's fundamentals.
How might this affect other cryptocurrencies? Ethereum's status as the leading altcoin means institutional doubts could spill over to smaller projects, particularly those in the Ethereum ecosystem.
Source Note: Market data and factual reporting in this article are sourced from original reports. Commentary and analysis provided by CoinMarketBuzz.

Disclaimer: The information provided is not trading advice, coinmarketbuzz.com holds no liability for any investments made based on the information provided on this page. We strongly recommend independent research and/or consultation with a qualified professional before making any investment decisions.
coinmarketbuzz.com leverages advanced AI technology to analyze market data. All content is fact-checked and reviewed by our editorial team to ensure accuracy and neutrality.