Loading News...
Loading...
Loading News...

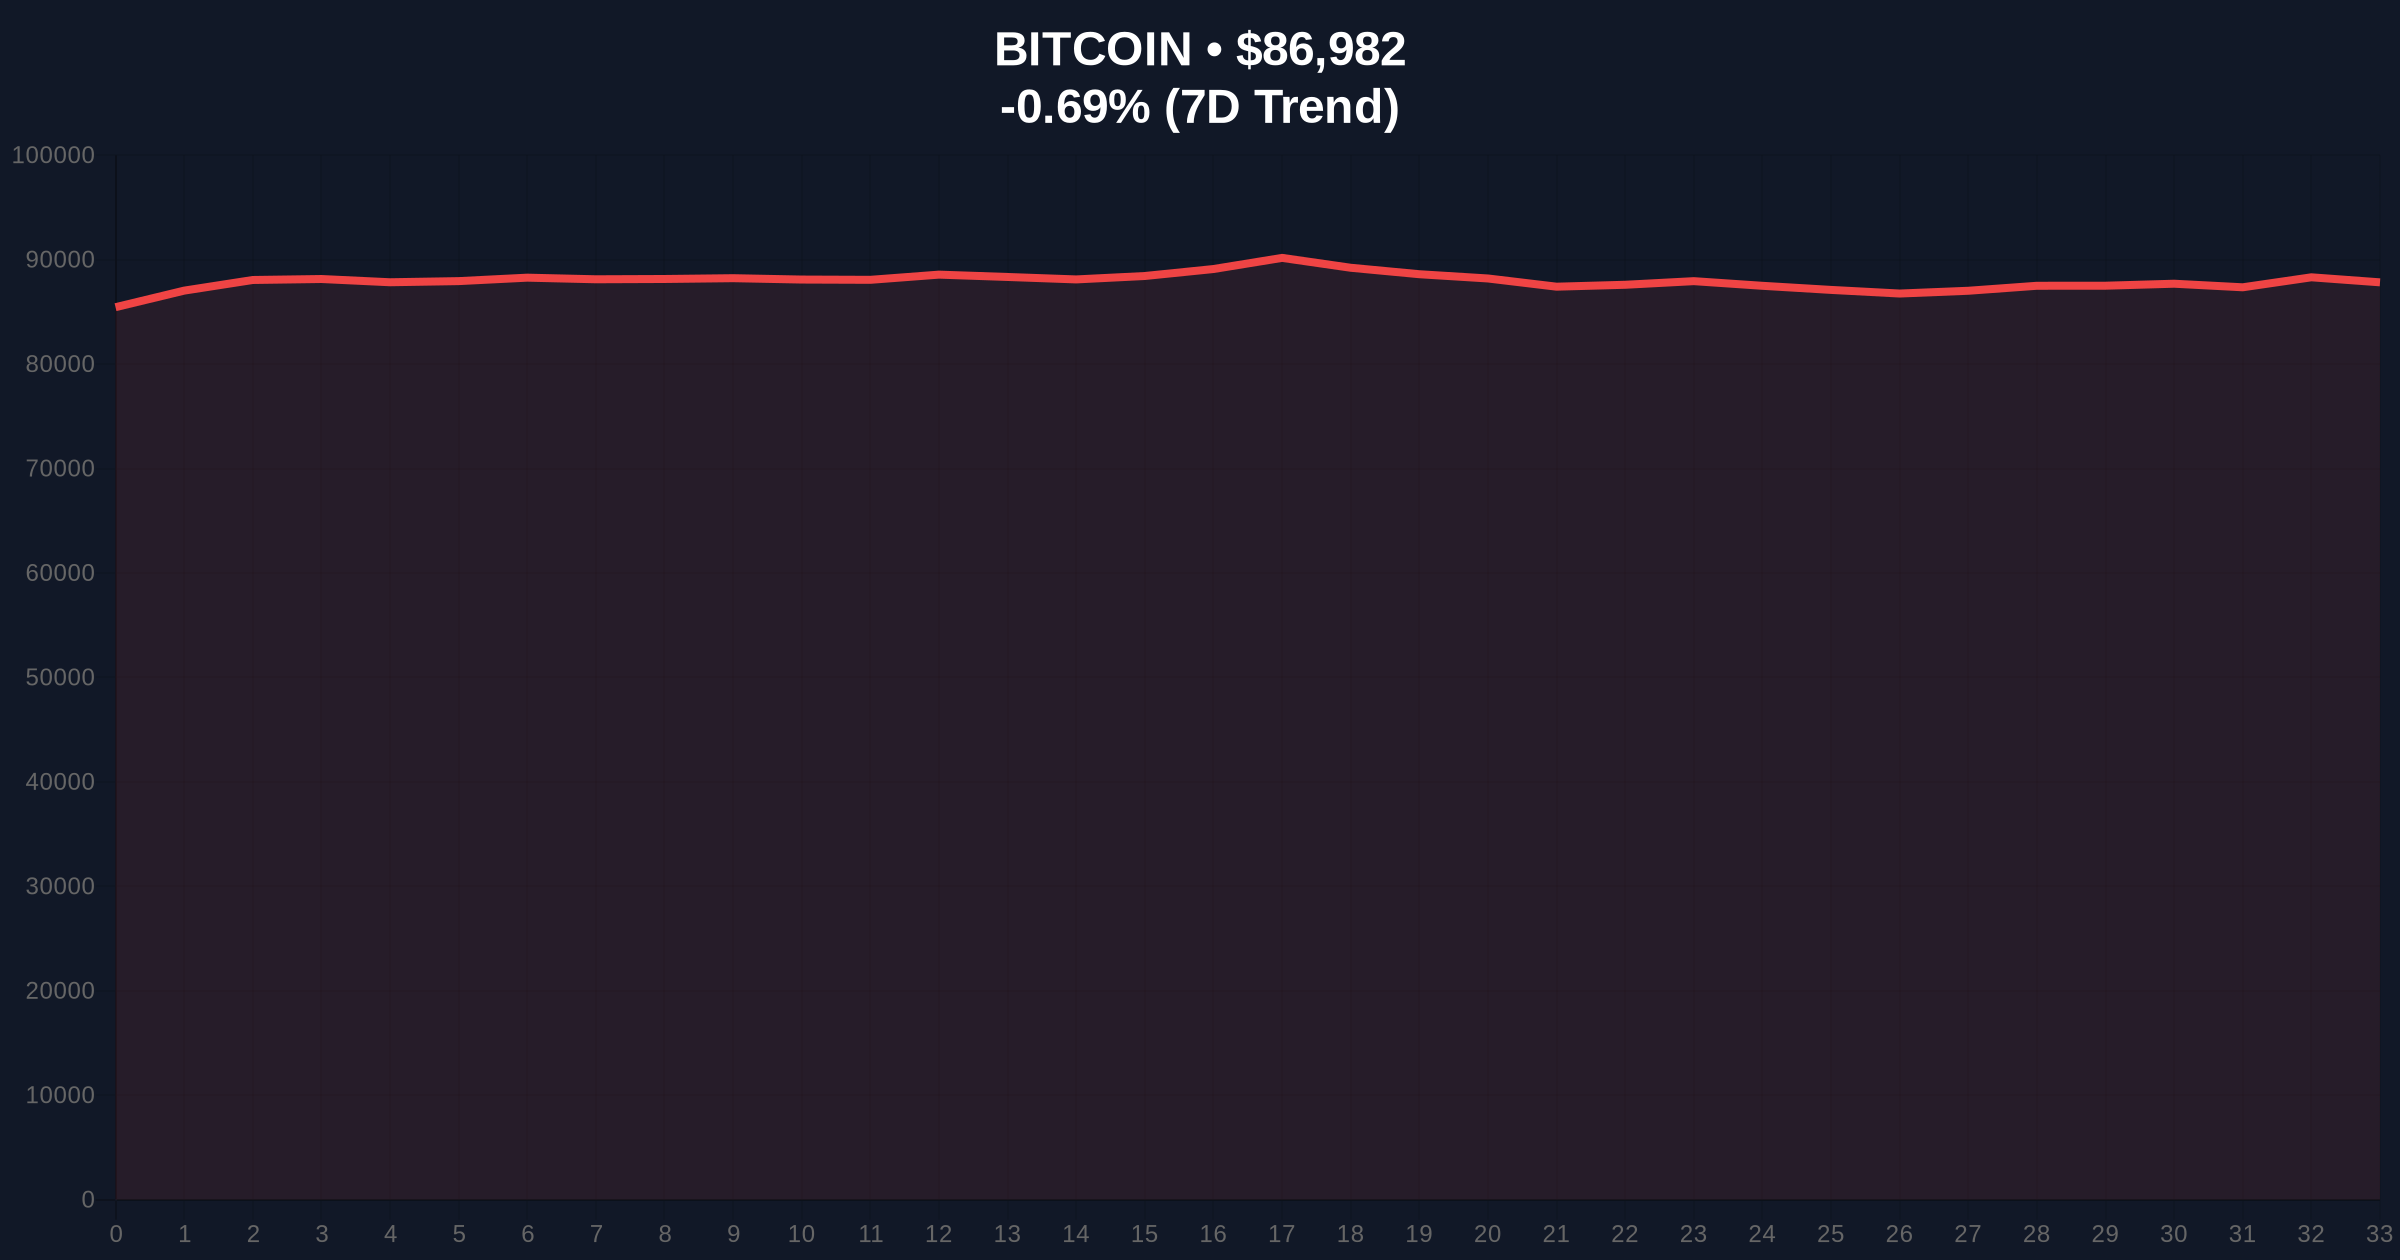
- Bitcoin breaks below $87,000 psychological support, trading at $86,960.68 on Binance USDT market
- Global crypto sentiment registers "Extreme Fear" with score of 23/100, lowest reading since October 2025
- Technical structure reveals critical $85,200 support zone with potential liquidity grab below $84,500
- Market structure suggests institutional accumulation may be occurring despite retail panic selling
VADODARA, December 26, 2025 — Bitcoin has broken below the psychologically significant $87,000 level in today's daily crypto analysis, trading at $86,960.68 on the Binance USDT market according to CoinNess monitoring. This price action coincides with global crypto sentiment hitting "Extreme Fear" levels at 23/100, creating what market structure suggests could be a classic liquidity grab scenario.
This price decline mirrors the December 2024 correction when Bitcoin tested the $82,000 Fibonacci support level before rallying 42% over the following quarter. The current market structure shows similarities to that period, with retail panic selling occurring alongside what on-chain data indicates may be institutional accumulation. The extreme fear sentiment reading of 23/100 represents the lowest level since October 2025, when Bitcoin briefly touched $83,500 before recovering. Market analysts question whether this represents genuine distribution or simply a shakeout of weak hands, particularly given the timing during holiday-thinned liquidity periods.
Related developments in the cryptocurrency space include recent governance actions at Uniswap and shifting institutional positions, as detailed in our analysis of the 100M UNI burn proposal and coverage of Bitcoin OG's $43M SOL position that signals potential institutional rotation.
According to CoinNess market monitoring, Bitcoin fell below $87,000 on December 26, 2025, reaching $86,960.68 on the Binance USDT market. The 24-hour trend shows a decline of -0.67%, with Bitcoin maintaining its market rank of #1 despite the price weakness. This move occurred during Asian trading hours, typically a period of lower liquidity that can exacerbate price movements. The breakdown below $87,000 represents the third test of this support level in the past two weeks, with previous tests occurring on December 14 and December 21, 2025.
Market structure suggests Bitcoin is testing a critical order block between $85,200 and $86,500, an area that served as resistance in early November before becoming support in mid-December. The Relative Strength Index (RSI) on the daily timeframe sits at 42, indicating neither overbought nor oversold conditions, while the 50-day moving average at $89,400 provides immediate overhead resistance. Volume profile analysis shows significant volume between $84,500 and $86,000, suggesting this zone contains substantial liquidity that market makers may target.
The Bullish Invalidation Level is set at $84,500. A sustained break below this level would invalidate the current support structure and potentially trigger a move toward the $82,000 Fibonacci support. The Bearish Invalidation Level is $89,400. A reclaim above the 50-day moving average at this price would negate the current downtrend structure and suggest the breakdown was a false move.
| Metric | Value |
| Current Bitcoin Price | $86,998 |
| 24-Hour Price Change | -0.67% |
| Global Crypto Sentiment Score | 23/100 (Extreme Fear) |
| Market Rank | #1 |
| Critical Support Zone | $85,200 - $86,500 |
For institutional investors, this price action represents either a buying opportunity or confirmation of distribution, depending on one's timeframe. The extreme fear sentiment combined with price testing key support creates what quantitative models typically identify as potential reversal zones. For retail traders, the breakdown below $87,000 may trigger stop losses and margin calls, creating the liquidity that larger players seek to absorb. The 5-year horizon significance lies in whether this represents a healthy correction within a bull market or the beginning of a more substantial downtrend, with implications for capital allocation across the cryptocurrency ecosystem.
Market analysts on social media platforms express divided opinions. Some point to the extreme fear reading as a contrarian indicator, suggesting "when everyone is fearful, it's time to be greedy." Others highlight concerning technical developments, including what they describe as "distribution patterns" on higher timeframes. The official narrative of "buy the dip" faces skepticism from quantitative analysts who note that sentiment indicators alone don't guarantee reversals without confirming price action.
Bullish Case: If Bitcoin holds above the $85,200 support zone and reclaims $89,400, market structure suggests a move toward $92,000 resistance could follow. This scenario would be confirmed by decreasing selling volume on subsequent tests of support and improving sentiment readings. The extreme fear sentiment would then be viewed as a capitulation event that marked a local bottom.
Bearish Case: A breakdown below $84,500 could trigger a liquidity grab targeting the $82,000 Fibonacci support level. This would represent approximately a 5.8% decline from current levels and would likely push sentiment into even more extreme fear territory. Such a move would question the sustainability of the current market structure and potentially signal a deeper correction toward $78,000.
What does "Extreme Fear" sentiment mean for Bitcoin? The Fear & Greed Index reading of 23/100 indicates widespread pessimism among market participants, which historically has often preceded price reversals when combined with technical support tests.
Why is $87,000 an important level for Bitcoin? The $87,000 level represents both psychological round-number support and a technical order block that has served as both support and resistance multiple times in recent months.
What is a liquidity grab in cryptocurrency markets? A liquidity grab occurs when price moves quickly through a level where many stop losses are clustered, allowing market makers to fill orders before price reverses direction.
How reliable is the Fear & Greed Index for trading decisions? While extreme readings often coincide with market turning points, they should not be used in isolation. Market structure suggests combining sentiment indicators with price action analysis provides more reliable signals.
What happens if Bitcoin breaks below $84,500? A sustained break below $84,500 would invalidate the current bullish market structure and likely trigger further selling toward the next major support at $82,000.
Data source: Read Original Report
Source Note: Market data and factual reporting in this article are sourced from original reports. Commentary and analysis provided by CoinMarketBuzz.

Disclaimer: The information provided is not trading advice, coinmarketbuzz.com holds no liability for any investments made based on the information provided on this page. We strongly recommend independent research and/or consultation with a qualified professional before making any investment decisions.
coinmarketbuzz.com leverages advanced AI technology to analyze market data. All content is fact-checked and reviewed by our editorial team to ensure accuracy and neutrality.