Loading News...
Loading...
Loading News...

- BTC perpetual futures show nearly balanced positioning with 50.19% long positions across top exchanges
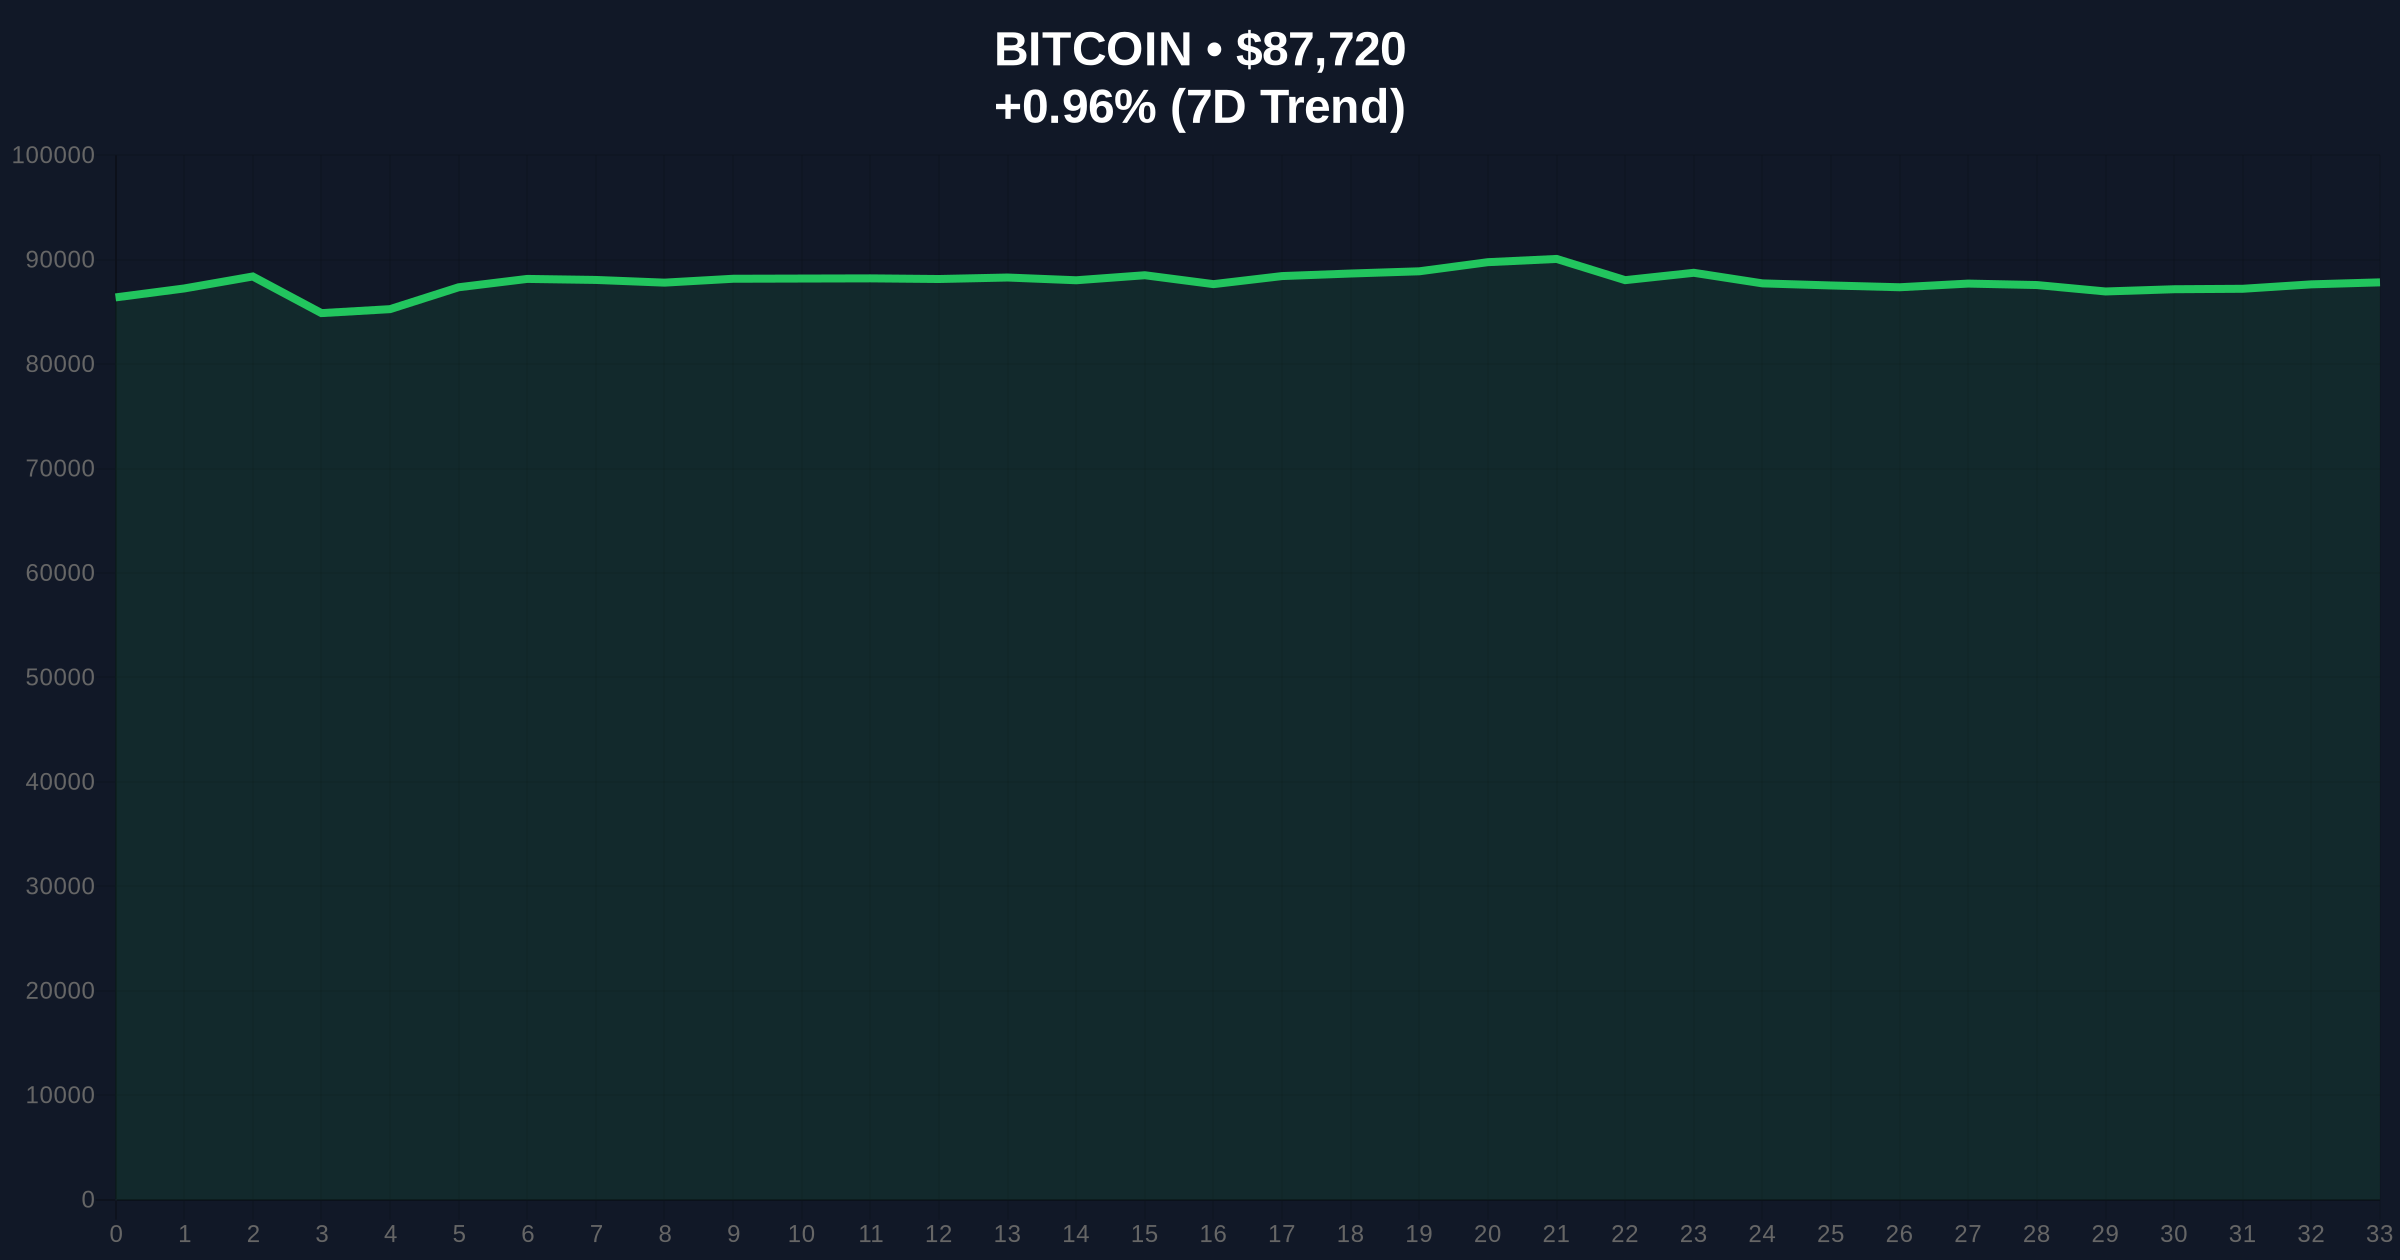
- Market sentiment registers "Extreme Fear" at 23/100 despite Bitcoin trading at $87,722
- Technical structure reveals critical support at $85,200 with bearish invalidation at $83,500
- Contradiction emerges between neutral futures positioning and extreme fear sentiment metrics
VADODARA, December 25, 2025 — Bitcoin perpetual futures positioning reveals a nearly perfect equilibrium between long and short positions across major exchanges, creating a technical stalemate that contradicts the prevailing "Extreme Fear" market sentiment. This daily crypto analysis examines the structural implications of 50.19% long positions against a backdrop of institutional outflows and technical vulnerability.
Market structure suggests perpetual futures positioning has historically served as a leading indicator for directional bias, particularly when diverging from broader sentiment metrics. The current 50.19% long ratio represents the most neutral positioning since the September 2025 consolidation period, which preceded a 14% correction. This mirrors the 2021 pattern where balanced futures positioning preceded significant volatility events, including the May 2021 flash crash that saw Bitcoin decline 35% in seven days. The current environment features multiple contradictory signals: neutral futures positioning against extreme fear sentiment, stable price action against significant ETF outflows, and retail accumulation against institutional distribution patterns.
Related developments include recent analysis of Bitcoin ETF outflows reaching $175 million and examination of historical liquidity grab events on Binance that created similar technical setups.
According to exchange data from December 25, 2025, Bitcoin perpetual futures across the three largest cryptocurrency derivatives platforms by open interest show minimal directional bias. The aggregate ratio stands at Long 50.19% / Short 49.81%, with Bybit displaying the most bullish skew at 51.01% long positions versus Binance's nearly perfect equilibrium at 50.08% long. This data, sourced from Coinness market intelligence, represents 24-hour positioning metrics that typically reflect short-term trader sentiment rather than structural market positioning. The numbers contradict the Crypto Fear & Greed Index reading of 23/100, which classifies current sentiment as "Extreme Fear"—a level historically associated with capitulation events rather than balanced futures positioning.
Bitcoin currently trades at $87,722 with a 24-hour trend of 0.96%. Volume profile analysis indicates significant accumulation between $85,200 and $87,000, creating a support zone that must hold for bullish continuation. The 50-day exponential moving average at $89,400 acts as immediate resistance, while the 200-day simple moving average provides structural support at $82,800. RSI readings at 48 suggest neutral momentum with slight bearish bias. Market structure suggests the critical Fibonacci 0.618 retracement level from the 2024 low to the 2025 high sits at $83,500, creating a confluence zone with the 200-day SMA.
Bullish invalidation occurs below $83,500, which would break both the Fibonacci support and 200-day moving average, potentially triggering a cascade of stop-loss orders. Bearish invalidation requires a sustained break above $91,200, which would fill the Fair Value Gap created during the December 18th sell-off and invalidate the current distribution pattern.
| Metric | Value |
| BTC Current Price | $87,722 |
| 24-Hour Change | 0.96% |
| Futures Long Ratio (Aggregate) | 50.19% |
| Crypto Fear & Greed Index | 23/100 (Extreme Fear) |
| Bybit Long Ratio | 51.01% |
For institutional participants, the neutral futures positioning suggests sophisticated traders are avoiding directional bets ahead of potential macroeconomic catalysts, including the Federal Reserve's January policy decision. The Federal Open Market Committee calendar shows the next meeting scheduled for January 28-29, 2026, creating a temporal compression effect on volatility expectations. Retail traders face increased risk from the sentiment-data contradiction: extreme fear readings typically signal buying opportunities, but neutral futures positioning suggests professional traders see limited upside potential. This divergence creates a potential liquidity grab scenario where retail sentiment becomes the fuel for institutional profit-taking.
Market analysts on X/Twitter express skepticism about the sustainability of current price levels. One quantitative trader noted, "The 50.19% long ratio is statistically insignificant—this is noise, not signal. Real positioning happens in options markets, where put/call ratios tell a different story." Another analyst observed, "Extreme fear with neutral futures is the market equivalent of a deer in headlights. Nobody wants to commit until something breaks." The consensus among technical analysts suggests waiting for a clear break of the $85,200-$91,200 range before establishing directional bias.
Bullish Case: If Bitcoin holds above $85,200 and breaks through the 50-day EMA resistance at $89,400, market structure suggests a retest of the December high at $94,800. This scenario requires sustained buying pressure and a shift in futures positioning above 52% long ratio. The catalyst would likely be positive institutional flow data or favorable regulatory developments regarding spot Bitcoin ETF approvals in additional jurisdictions.
Bearish Case: A break below $83,500 triggers the bullish invalidation level and could initiate a decline toward the next significant support at $79,200, representing a 9.7% correction from current levels. This scenario aligns with the extreme fear sentiment reading and would likely coincide with increased ETF outflows and negative gamma exposure from options markets. The EIP-4844 implementation timeline for Ethereum, scheduled for Q1 2026, could create capital rotation pressure if delayed or encountering technical issues.
What does a 50.19% long ratio mean for Bitcoin price? Market structure suggests neutral positioning indicates uncertainty rather than directional bias. Historically, such balanced ratios precede increased volatility as the market searches for a catalyst.
Why is there extreme fear sentiment when Bitcoin is near $88,000? Sentiment metrics often lag price action and incorporate multiple factors including ETF flows, regulatory news, and macroeconomic conditions. The current reading reflects institutional outflows and technical vulnerability despite relatively stable prices.
What exchange has the most bullish Bitcoin futures positioning? Bybit shows 51.01% long positions versus 48.99% short, making it the most bullish among major exchanges. However, the 1.02% differential is statistically marginal.
How reliable are perpetual futures ratios as market indicators? As leading indicators, they have moderate reliability when diverging significantly from 50/50. At current levels near equilibrium, they provide limited predictive value and must be analyzed alongside volume, open interest, and options market data.
What technical level is most critical for Bitcoin right now? The $83,500 level represents both Fibonacci support and the 200-day moving average confluence. A break below this creates structural bearish implications, while holding above maintains the broader uptrend framework.
Source Note: Market data and factual reporting in this article are sourced from original reports. Commentary and analysis provided by CoinMarketBuzz.

Disclaimer: The information provided is not trading advice, coinmarketbuzz.com holds no liability for any investments made based on the information provided on this page. We strongly recommend independent research and/or consultation with a qualified professional before making any investment decisions.
coinmarketbuzz.com leverages advanced AI technology to analyze market data. All content is fact-checked and reviewed by our editorial team to ensure accuracy and neutrality.