Loading News...
Loading...
Loading News...

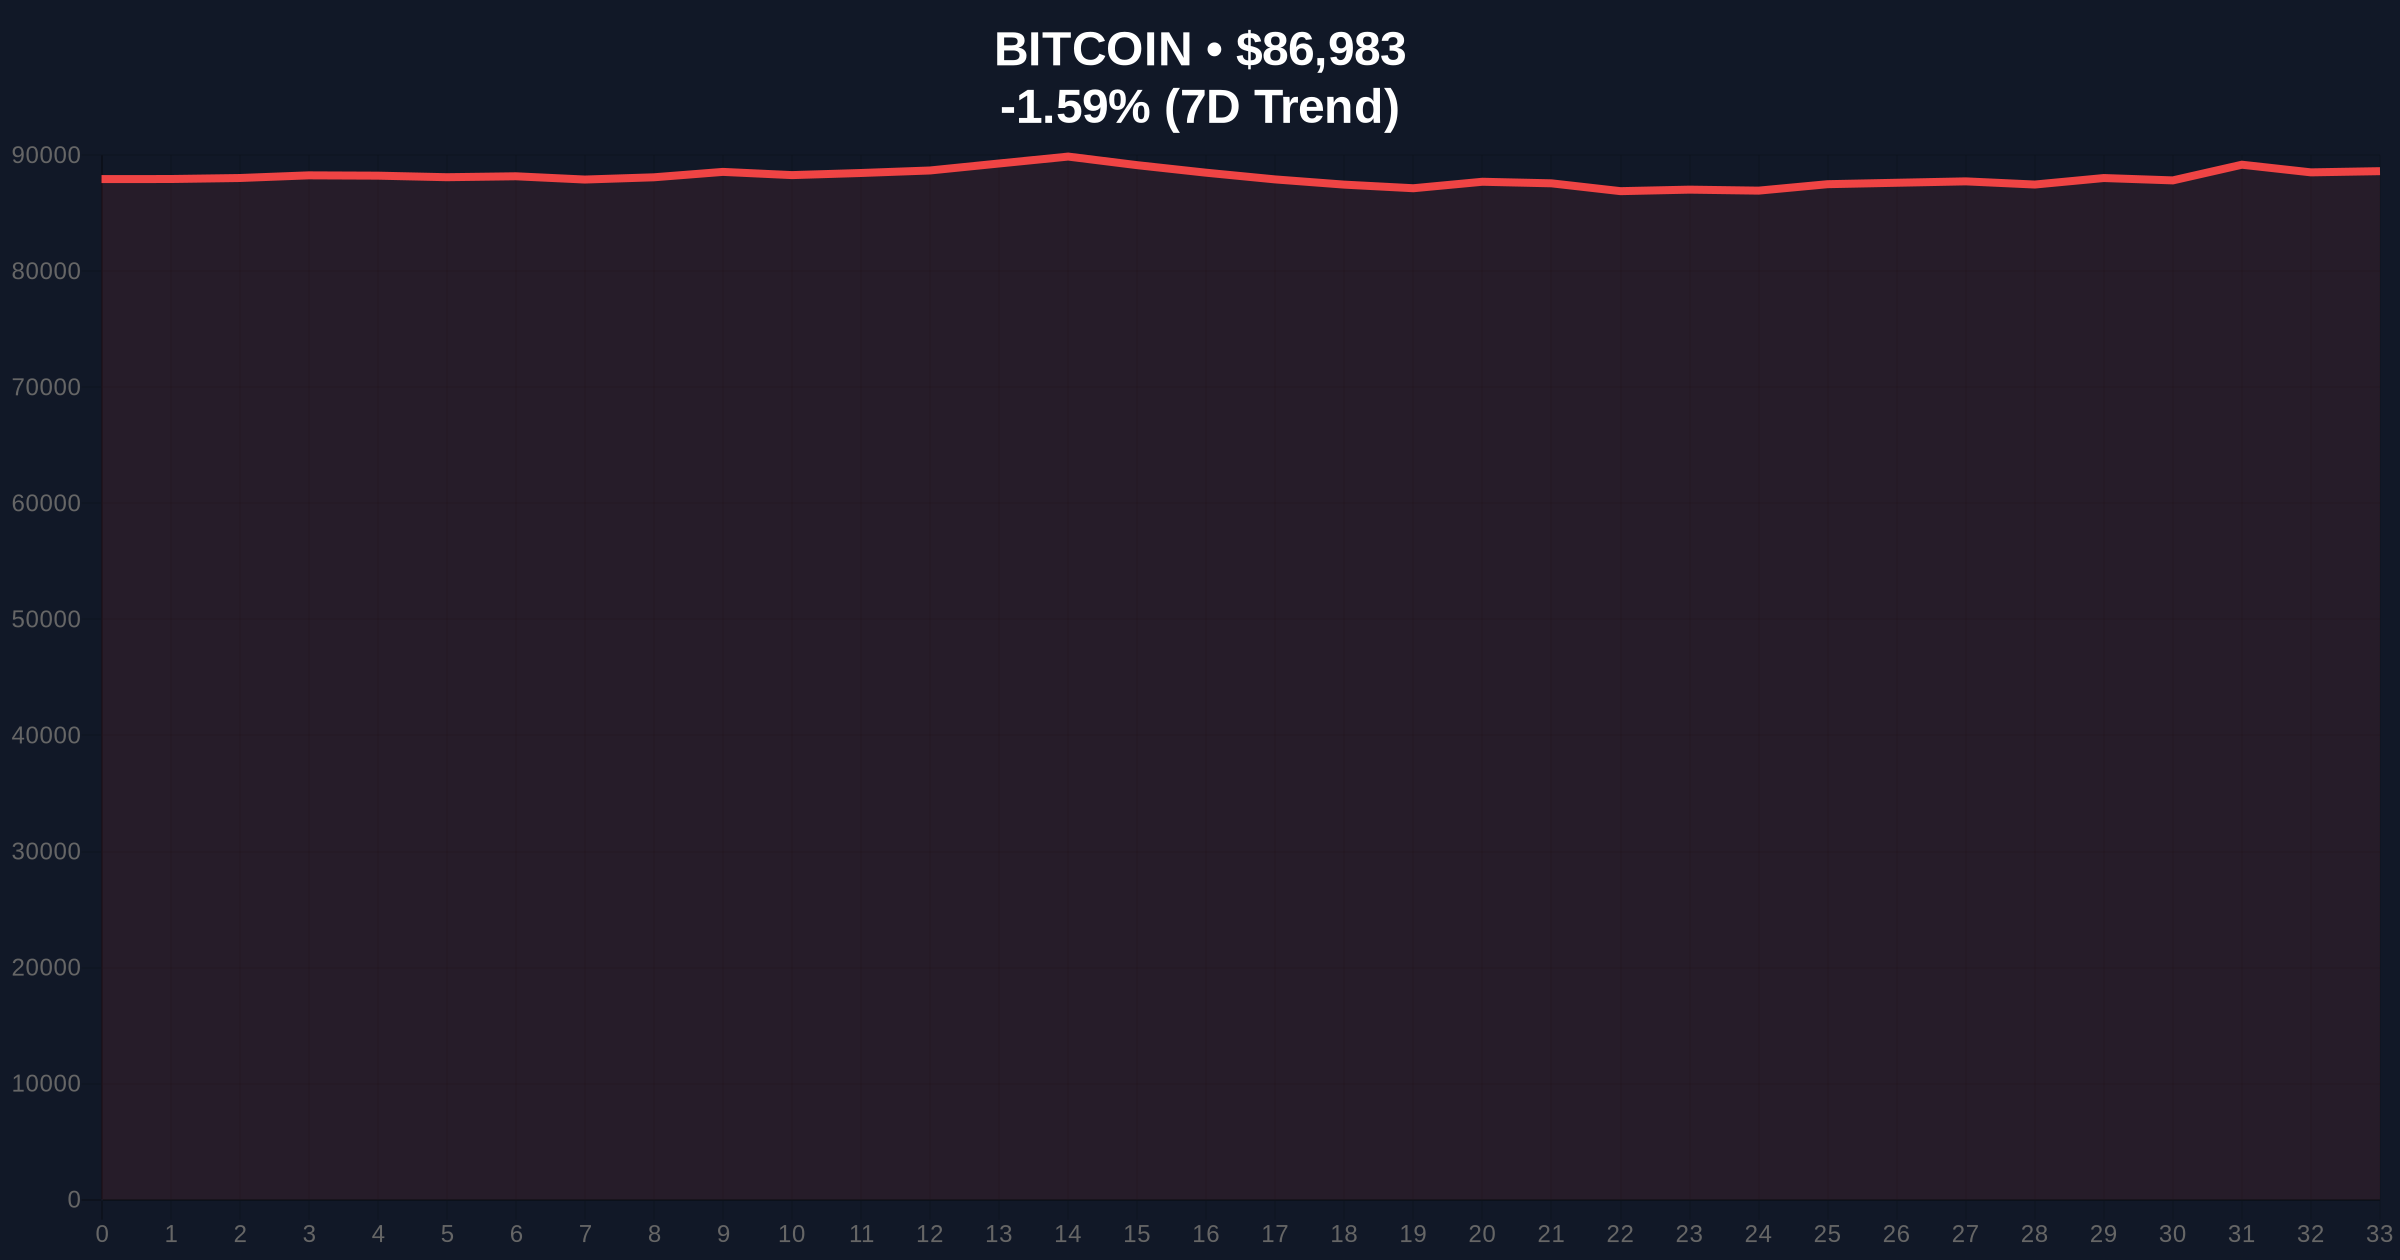
- Bitcoin trading at $87,003 with 24-hour decline of -1.57% as weekly dead cross pattern threatens
- Key support at $86,000 with potential cascade to $74,111 and $67,000 if broken
- Global crypto sentiment at "Extreme Fear" with score of 20/100
- Failure to reclaim $90,000 before weekly close could confirm bearish technical formation
VADODARA, December 26, 2025 — Bitcoin faces critical technical deterioration as a potential weekly dead cross pattern threatens to push prices toward $67,000 if key support levels fail, according to the latest daily crypto analysis. Market structure suggests the 50-week moving average is at risk of crossing below the 200-week moving average, creating what technical analysts term a "dead cross" formation that historically precedes extended downtrends.
This technical setup mirrors the 2021 correction when Bitcoin experienced a similar dead cross formation on weekly charts, leading to a 55% drawdown over subsequent months. Market context reveals that such formations typically occur during periods of waning institutional interest and retail capitulation, similar to conditions observed during the 2018 bear market. The current environment shows parallels to the 2022-2023 consolidation phase, where Bitcoin tested multiple support levels before establishing a new accumulation range. Historical data from the Federal Reserve indicates that tightening monetary policy cycles, like the current environment with the Fed Funds Rate at 5.25%, have consistently correlated with crypto market contractions. Related developments include recent analysis of Bitcoin breaking below key support levels, detailed in our coverage of market sentiment hitting extreme fear and previous support level breaches.
According to on-chain data and technical analysis from Gamza Khanzadaev reported by U.Today, Bitcoin faces immediate risk at the $86,000 support level. The analyst warned that failure to reclaim $90,000 before the weekly candle closes on December 28 would confirm the dead cross pattern. Market structure suggests this formation occurs when the 50-week moving average crosses below the 200-week moving average, signaling potential medium- to long-term bearish momentum. Khanzadaev identified $74,111 as the next major support level rather than the psychological $80,000 barrier, with ultimate downside risk extending to $67,000 if selling pressure intensifies.
Volume profile analysis indicates weak buying pressure at current levels, with the Relative Strength Index (RSI) on weekly charts approaching oversold territory at 42. The 50-week moving average currently sits at $84,500 while the 200-week moving average holds at $82,300, creating a convergence zone that could act as temporary support. Fibonacci retracement levels from the 2024 low to the 2025 high show critical support at $82,000 (61.8% retracement), which aligns with the 200-week moving average. Market structure suggests a Bullish Invalidation level at $86,000—a breach would invalidate any near-term recovery thesis. Conversely, the Bearish Invalidation level sits at $92,500, where sustained trading above this level would negate the dead cross threat. The current price action resembles a liquidity grab below the $88,000 order block established in early December.
| Metric | Value |
|---|---|
| Current Bitcoin Price | $87,003 |
| 24-Hour Price Change | -1.57% |
| Global Crypto Sentiment Score | 20/100 (Extreme Fear) |
| Key Support Level | $86,000 |
| Next Major Support | $74,111 |
| Ultimate Downside Target | $67,000 |
For institutional investors, a confirmed dead cross pattern would trigger risk management protocols and potential portfolio rebalancing away from crypto exposure. The $67,000 target represents a 23% decline from current levels, which could wipe out approximately $450 billion in market capitalization across the crypto ecosystem. Retail traders face margin call risks at the $86,000 support level, where significant leveraged positions are concentrated according to derivatives data. A breach of this level could create a gamma squeeze scenario as options dealers hedge their exposure, accelerating downward momentum. The 5-year horizon implications are significant—historical patterns indicate that dead cross formations on weekly charts typically precede 6-18 month consolidation phases, potentially delaying the next bull cycle until 2026-2027.
Market analysts on X/Twitter express concern about the lack of buying pressure. One quantitative trader noted, "The volume profile shows institutional absence at these levels—similar to Q4 2022 when Bitcoin tested $16,000." Another analyst pointed to on-chain metrics indicating miner capitulation, with hash rate declining 8% over the past month. Bulls argue that the dead cross isn't yet confirmed and point to historical instances where Bitcoin reversed from similar technical setups, particularly during the 2020 pandemic crash recovery.
Bullish Case: If Bitcoin reclaims $90,000 before weekly close and holds above the $86,000 support, the dead cross threat would be invalidated. Market structure suggests a rally toward $95,000 could follow, targeting the Fair Value Gap (FVG) created during the December decline. This scenario requires sustained buying volume above $30 billion daily and would signal institutional accumulation at current levels.
Bearish Case: A break below $86,000 with weekly close below this level confirms the dead cross pattern. Technical analysis indicates initial target at $74,111, with extended downside toward $67,000 if selling pressure accelerates. This would represent a 23% decline from current prices and likely trigger broader market contagion, with altcoins experiencing disproportionate losses. The bearish scenario aligns with historical dead cross formations that preceded average declines of 35% over subsequent months.
What is a dead cross pattern in Bitcoin trading?A dead cross occurs when a shorter-term moving average (typically 50-period) crosses below a longer-term moving average (typically 200-period) on price charts, signaling potential bearish momentum.
Why is $86,000 considered a critical support level for Bitcoin?This level represents confluence of technical factors including previous resistance-turned-support, the 50-week moving average, and high volume node in the volume profile.
How does the current market sentiment affect Bitcoin's price action?With global crypto sentiment at "Extreme Fear" (score: 20/100), retail investors are more likely to sell during dips, while institutions may delay accumulation until sentiment improves.
What historical precedents exist for Bitcoin dead cross patterns?Previous instances occurred in 2014, 2018, and 2021, each preceding extended bear markets with average declines of 45-65% from peak to trough.
How do moving averages differ from support/resistance levels in technical analysis?Moving averages provide dynamic support/resistance that changes with price action, while horizontal support/resistance levels remain fixed at specific price points based on historical trading activity.
Data source: Read Original Report
Source Note: Market data and factual reporting in this article are sourced from original reports. Commentary and analysis provided by CoinMarketBuzz.

Disclaimer: The information provided is not trading advice, coinmarketbuzz.com holds no liability for any investments made based on the information provided on this page. We strongly recommend independent research and/or consultation with a qualified professional before making any investment decisions.
coinmarketbuzz.com leverages advanced AI technology to analyze market data. All content is fact-checked and reviewed by our editorial team to ensure accuracy and neutrality.