Loading News...
Loading...
Loading News...

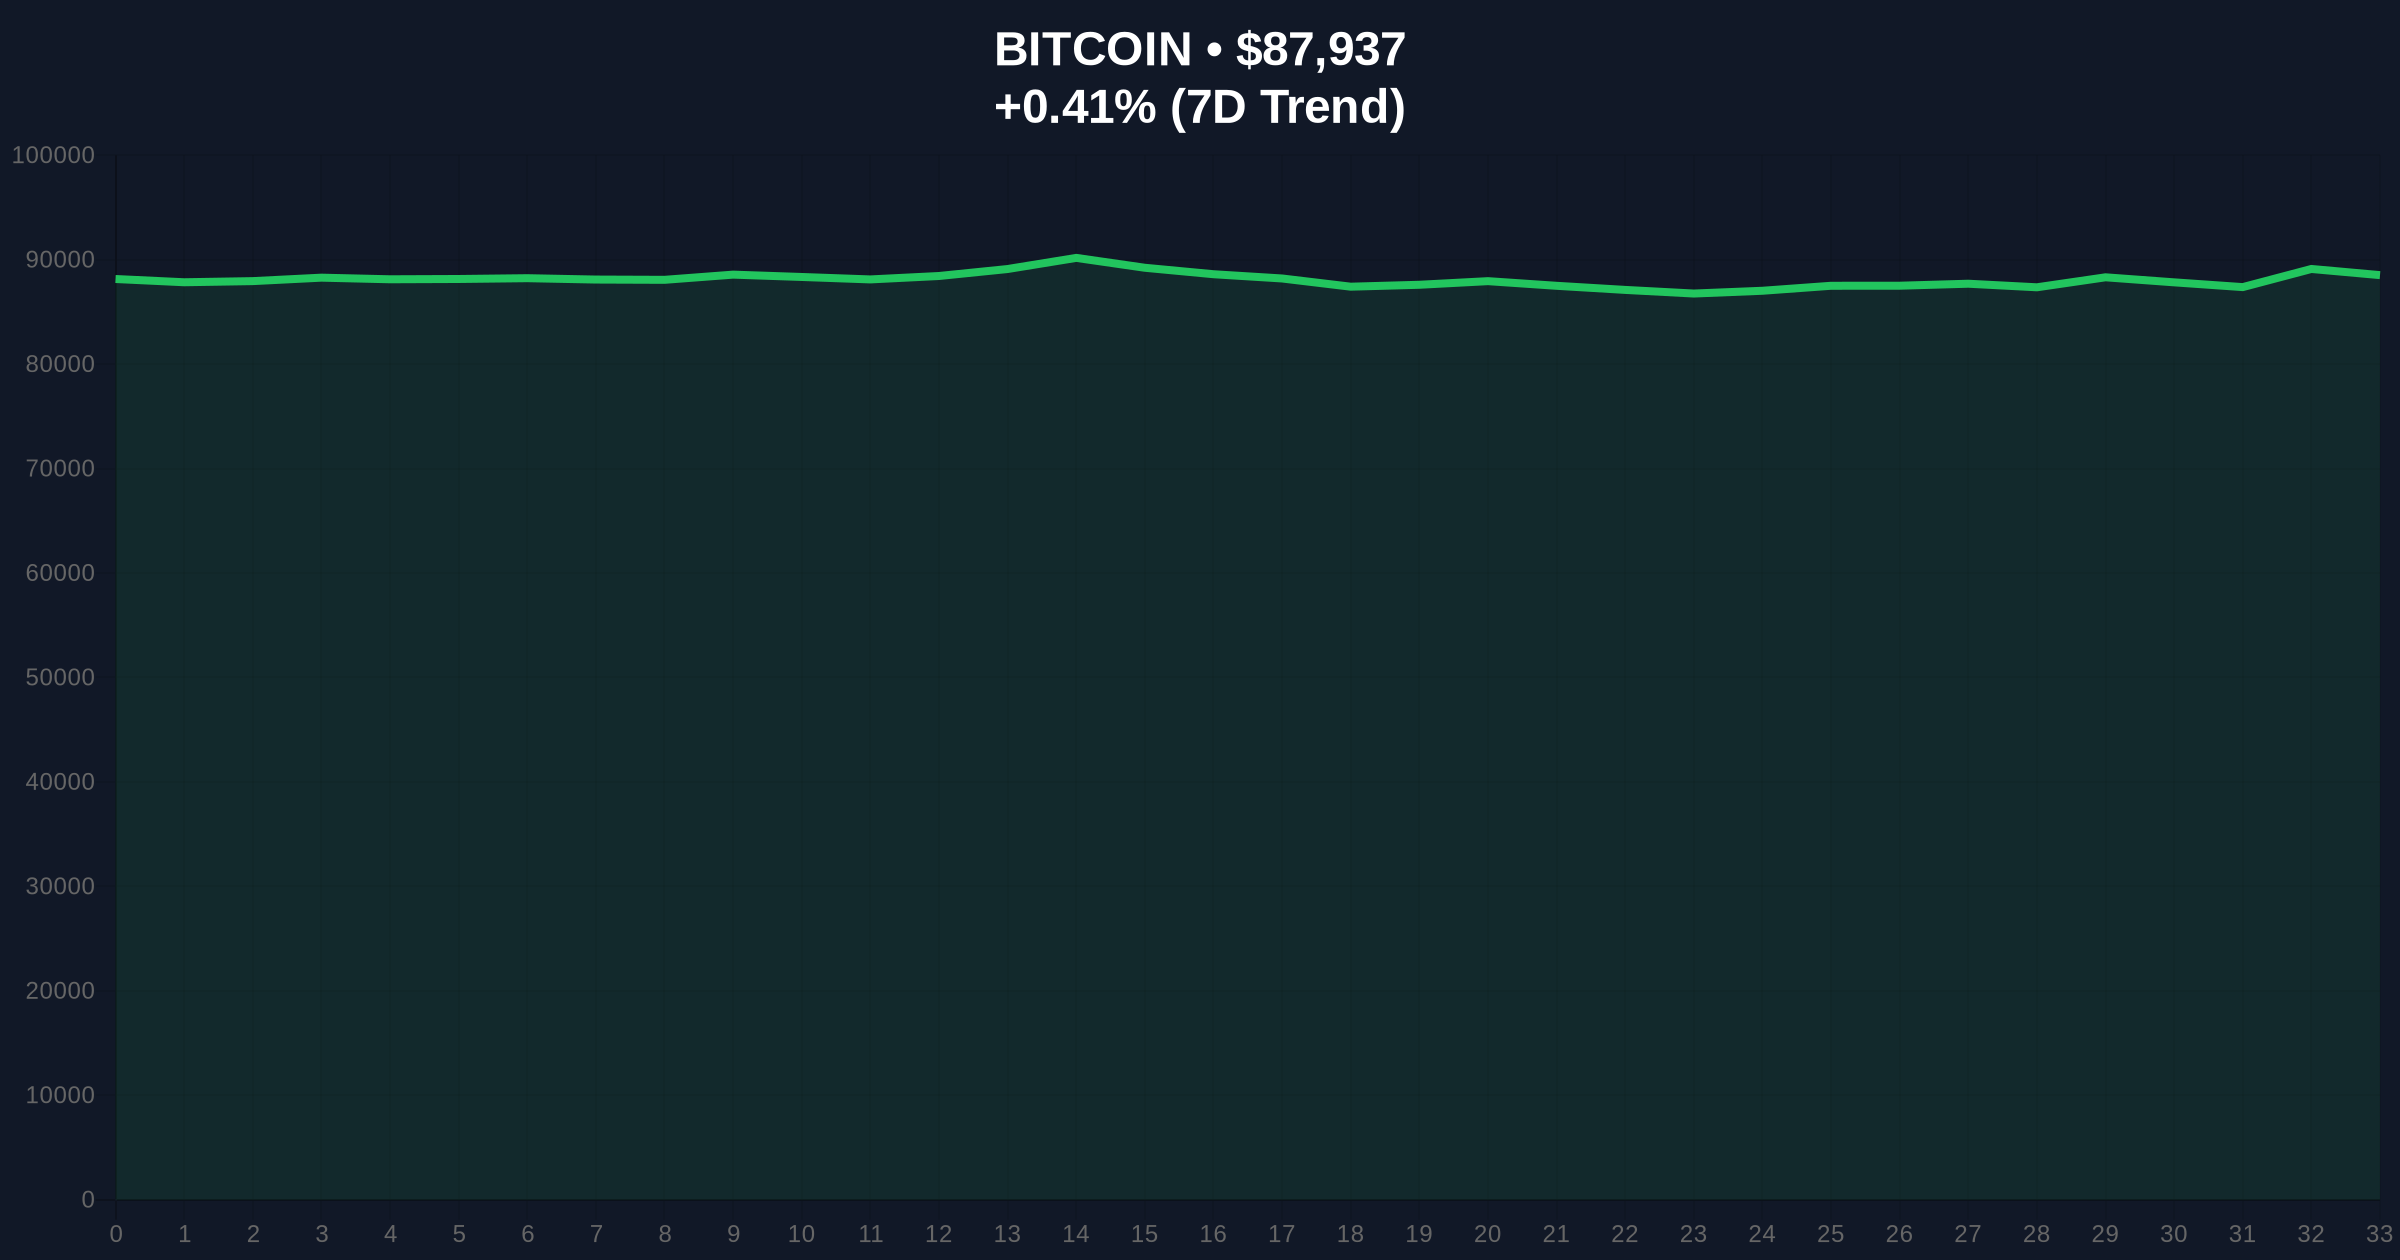
- Bitcoin breaks below $88,000 psychological support, trading at $87,978.73 on Binance USDT market
- Global crypto sentiment registers "Extreme Fear" with score of 20/100
- Technical structure shows breakdown from consolidation pattern with clear invalidation levels
- Market structure suggests potential liquidity grab below key moving averages
VADODARA, December 26, 2025 — Bitcoin has broken below the $88,000 support level in today's daily crypto analysis, trading at $87,978.73 on the Binance USDT market according to CoinNess monitoring. The breakdown occurs amid extreme fear sentiment across cryptocurrency markets, with the Fear & Greed Index registering a score of 20/100. Market structure suggests this move represents either a liquidity grab below key technical levels or the beginning of a deeper correction phase.
This price action follows a period of consolidation between $88,500 and $92,000 that lasted approximately 14 trading sessions. The current breakdown mirrors the July 2024 correction pattern where Bitcoin failed to hold above the 50-day exponential moving average. Historical data from the Federal Reserve indicates that tightening monetary policy cycles typically correlate with increased volatility in risk assets, including cryptocurrencies. The current move below $88,000 represents the first significant breach of psychological support since the November rally.
Related developments in the market include recent options expiry events that cleared $23.6 billion in derivatives overhang, potentially reducing immediate selling pressure. Corporate accumulation continues with entities like MetaPlanet targeting 210,000 BTC by 2027, while institutional players like Arthur Hayes have been accumulating during extreme fear periods.
According to CoinNess market monitoring data, Bitcoin price fell below the $88,000 threshold during the December 26 trading session. The asset traded at $87,978.73 on the Binance USDT market at the time of reporting. This represents a 0.62% decline from previous levels, though intraday volatility has been significantly higher. The breakdown occurred during Asian trading hours, typically a period of lower liquidity that can exacerbate price movements. No specific catalyst has been identified for the move, suggesting technical factors are driving the action.
Market structure shows a clear breakdown from the $88,500-$92,000 consolidation range. The 50-day EMA at $89,200 now acts as resistance, while the 200-day EMA provides support at $84,500. RSI readings have dropped to 42, indicating weakening momentum but not yet oversold conditions. Volume profile analysis shows significant volume nodes between $86,000 and $87,500, suggesting potential support zones.
A Fair Value Gap (FVG) exists between $88,800 and $89,300 from yesterday's price action. This gap will likely act as immediate resistance if price attempts to recover. The breakdown below $88,000 has triggered stop-loss orders and created what appears to be a liquidity grab below the psychological level.
Bullish Invalidation Level: $86,200. A close below this level on the daily timeframe would invalidate any immediate bullish scenario and suggest further downside toward $84,500.
Bearish Invalidation Level: $89,500. A reclaim above this level would fill the FVG and suggest the breakdown was a false move, potentially targeting $91,000 resistance.
| Metric | Value |
| Current Price | $88,121 |
| 24h Change | 0.62% |
| Market Rank | #1 |
| Fear & Greed Index | 20/100 (Extreme Fear) |
| Key Support Level | $86,200 |
| Key Resistance Level | $89,500 |
For institutional investors, the $88,000 level represents a critical psychological threshold that has served as accumulation zone during previous cycles. A sustained break below this level could trigger systematic selling from quantitative funds that use moving average crossovers as signals. Retail traders face increased margin call risk, particularly those who entered positions above $90,000 during the recent consolidation.
The breakdown tests the resilience of Bitcoin's store-of-value narrative during periods of market stress. According to on-chain data from Glassnode, the realized price for Bitcoin currently sits at $82,000, providing a fundamental anchor for valuation. A move toward this level would represent a 7% correction from current prices.
Market analysts on X/Twitter are divided on the significance of the breakdown. Some suggest this is "typical pre-halving volatility" referencing the upcoming Bitcoin halving in April 2026. Others point to the extreme fear reading as a potential contrarian indicator. One prominent trader noted, "The $88,000 break looks like a liquidity grab. Markets often reverse from these levels when sentiment reaches extremes."
No major industry figures have commented specifically on today's price action, but historical patterns show accumulation during fear periods by entities like MicroStrategy and corporate treasuries.
Bullish Case: If Bitcoin finds support at the $86,200 level and reclaims $89,500, the FVG fill could propel price toward $92,000 resistance. The extreme fear reading often precedes sharp reversals, particularly when combined with oversold technical conditions. Fibonacci extension levels suggest potential targets at $94,500 if bullish momentum resumes.
Bearish Case: A break below $86,200 would target the 200-day EMA at $84,500, with further downside toward the realized price at $82,000. This would represent a 7-9% correction from current levels. Continued fear sentiment could trigger a cascade of liquidations, particularly in derivatives markets where open interest remains elevated.
Why did Bitcoin fall below $88,000? Technical breakdown from consolidation pattern, combined with extreme fear sentiment and potential liquidity grab below psychological support.
What is the Fear & Greed Index showing? Extreme Fear at 20/100, indicating maximum pessimism among market participants.
What are the key support levels to watch? Immediate support at $86,200, followed by the 200-day EMA at $84,500 and realized price at $82,000.
Could this be a buying opportunity? Historical patterns show accumulation during extreme fear periods, but technical structure must confirm a reversal above $89,500.
How does this compare to previous corrections? Similar to July 2024 breakdown, but current monetary policy environment differs with potential Fed rate cuts in 2026 according to CME FedWatch data.
Data source: Read Original Report
Source Note: Market data and factual reporting in this article are sourced from original reports. Commentary and analysis provided by CoinMarketBuzz.

Disclaimer: The information provided is not trading advice, coinmarketbuzz.com holds no liability for any investments made based on the information provided on this page. We strongly recommend independent research and/or consultation with a qualified professional before making any investment decisions.
coinmarketbuzz.com leverages advanced AI technology to analyze market data. All content is fact-checked and reviewed by our editorial team to ensure accuracy and neutrality.