Loading News...
Loading...
Loading News...


Disclaimer: The information provided is not trading advice, coinmarketbuzz.com holds no liability for any investments made based on the information provided on this page. We strongly recommend independent research and/or consultation with a qualified professional before making any investment decisions.
coinmarketbuzz.com leverages advanced AI technology to analyze market data. All content is fact-checked and reviewed by our editorial team to ensure accuracy and neutrality.
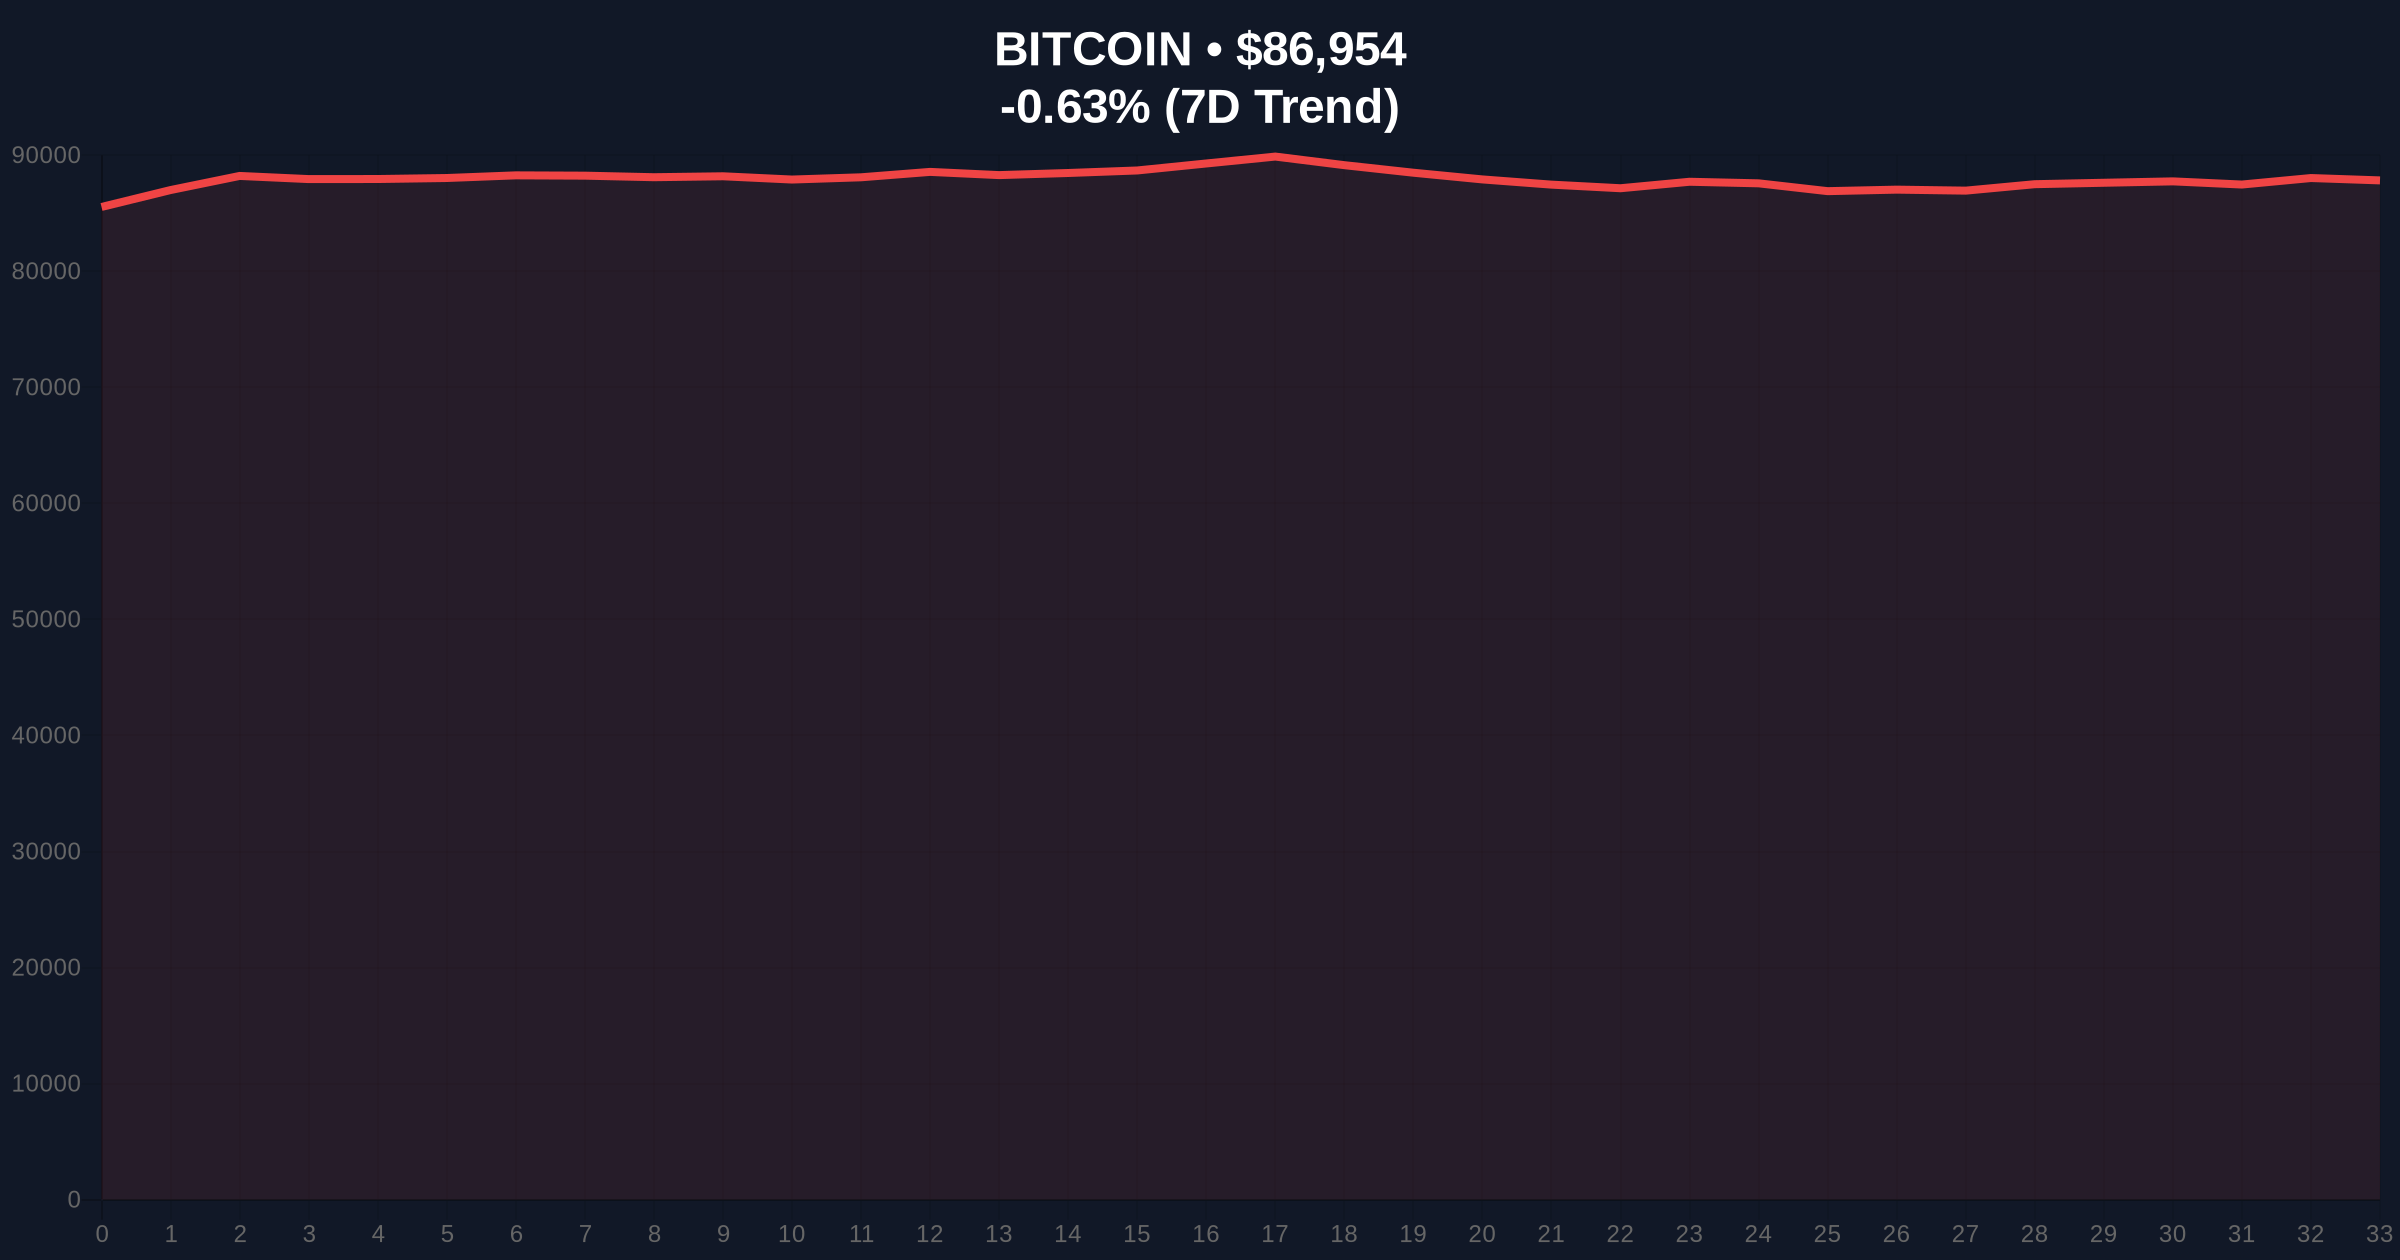
- Bitcoin trading at $86,959 with 24-hour decline of -0.63%
- Coin Days Destroyed metrics show no aggressive selling from long-term holders
- Global crypto sentiment at "Extreme Fear" with score of 20/100
- Market structure suggests correction is liquidity grab rather than trend reversal
VADODARA, December 26, 2025 — Bitcoin's current correction appears temporary according to on-chain analysis, with key metrics showing stable long-term holder behavior despite price dropping to $86,959. This Daily Crypto Analysis examines why market structure suggests this is a liquidity grab rather than a trend reversal.
Bitcoin has experienced multiple corrections during its current cycle, each testing different psychological levels. The current pullback mirrors the July 2024 correction that saw BTC test the $82,000 Fibonacci support level before resuming its upward trajectory. Market structure indicates these corrections serve to flush out weak hands and establish higher lows. The current environment of "Extreme Fear" with a score of 20/100 on the Fear & Greed Index creates optimal conditions for contrarian positioning. Related developments include the recent plunge in market sentiment and the record $23.3B Bitcoin options expiry that tested market structure earlier this month.
Crypto analyst Arab Chain, in a contribution to CryptoQuant, identified stable on-chain metrics despite Bitcoin's price decline. The Coin Days Destroyed (CDD) metric, which measures the movement of older coins, remains at moderate levels compared to historical market tops. Supply-Adjusted CDD shows similar stability, far from the sharp spikes observed during previous bull market peaks. According to the analysis, this indicates the recent BTC decline was not caused by large-scale selling from long-term investors. Instead, the correction appears to be a temporary adjustment due to slowing momentum and weakening liquidity conditions.
Bitcoin currently trades at $86,959, representing a -0.63% decline over the past 24 hours. The 50-day moving average at $84,200 provides immediate support, while the 200-day moving average at $78,500 serves as stronger structural support. RSI sits at 42, indicating neither overbought nor oversold conditions. Volume profile analysis shows significant liquidity between $85,000 and $87,000, creating a potential order block. The Fair Value Gap (FVG) between $88,500 and $90,000 represents an area of interest for price discovery. Bullish invalidation level: $82,000 (Fibonacci 0.618 retracement). Bearish invalidation level: $92,500 (previous resistance turned support).
| Metric | Value |
|---|---|
| Current Bitcoin Price | $86,959 |
| 24-Hour Change | -0.63% |
| Fear & Greed Index Score | 20/100 (Extreme Fear) |
| Market Rank | #1 |
| 50-Day Moving Average | $84,200 |
For institutional investors, stable long-term holder metrics suggest underlying strength despite price volatility. The absence of aggressive selling from older coins indicates conviction among sophisticated market participants. Retail traders face different dynamics, with the "Extreme Fear" sentiment potentially creating buying opportunities at discounted levels. The stability in Coin Days Destroyed metrics contrasts with previous market tops where this indicator spiked dramatically, providing quantitative evidence that this correction differs fundamentally from bear market transitions.
Market analysts on X/Twitter note the divergence between price action and on-chain fundamentals. One quantitative trader observed, "CDD metrics remain subdued while price corrects—classic liquidity grab pattern." Another analyst highlighted, "The Supply-Adjusted CDD staying stable suggests this isn't distribution from smart money." The consensus among technical analysts points to this being a healthy correction within an ongoing bull market structure.
Bullish Case: If Bitcoin holds above the $84,200 50-day moving average and fills the FVG between $88,500 and $90,000, the next target becomes $95,000. Continued stability in long-term holder metrics would support this scenario. The implementation of EIP-4844 on Ethereum's network could create positive spillover effects across the crypto market.
Bearish Case: A break below $82,000 Fibonacci support would invalidate the bullish structure and target $78,500 (200-day MA). This would require a fundamental shift in long-term holder behavior, with CDD metrics spiking to indicate distribution. Such a scenario would likely coincide with broader macroeconomic deterioration, potentially including Federal Reserve policy tightening beyond current expectations. More information on Federal Reserve policies can be found at FederalReserve.gov.
What is Coin Days Destroyed (CDD)? Coin Days Destroyed measures the movement of older Bitcoin coins by multiplying the number of coins moved by the number of days since they last moved. Higher values indicate older coins are being spent.
Why does stable CDD suggest a temporary correction? When long-term holders aren't selling aggressively (stable CDD), price declines typically represent short-term volatility rather than fundamental distribution.
What is the Fear & Greed Index? A sentiment indicator that measures market emotion from multiple data sources, with scores from 0-100 (Extreme Fear to Extreme Greed).
How does this correction compare to previous ones? Current CDD levels remain moderate compared to sharp spikes seen at previous market tops, suggesting different underlying dynamics.
What should traders watch for next? Key levels include the $84,200 50-day MA support and whether CDD metrics remain stable or begin showing distribution patterns.
Source Note: Market data and factual reporting in this article are sourced from original reports. Commentary and analysis provided by CoinMarketBuzz.