Loading News...
Loading...
Loading News...

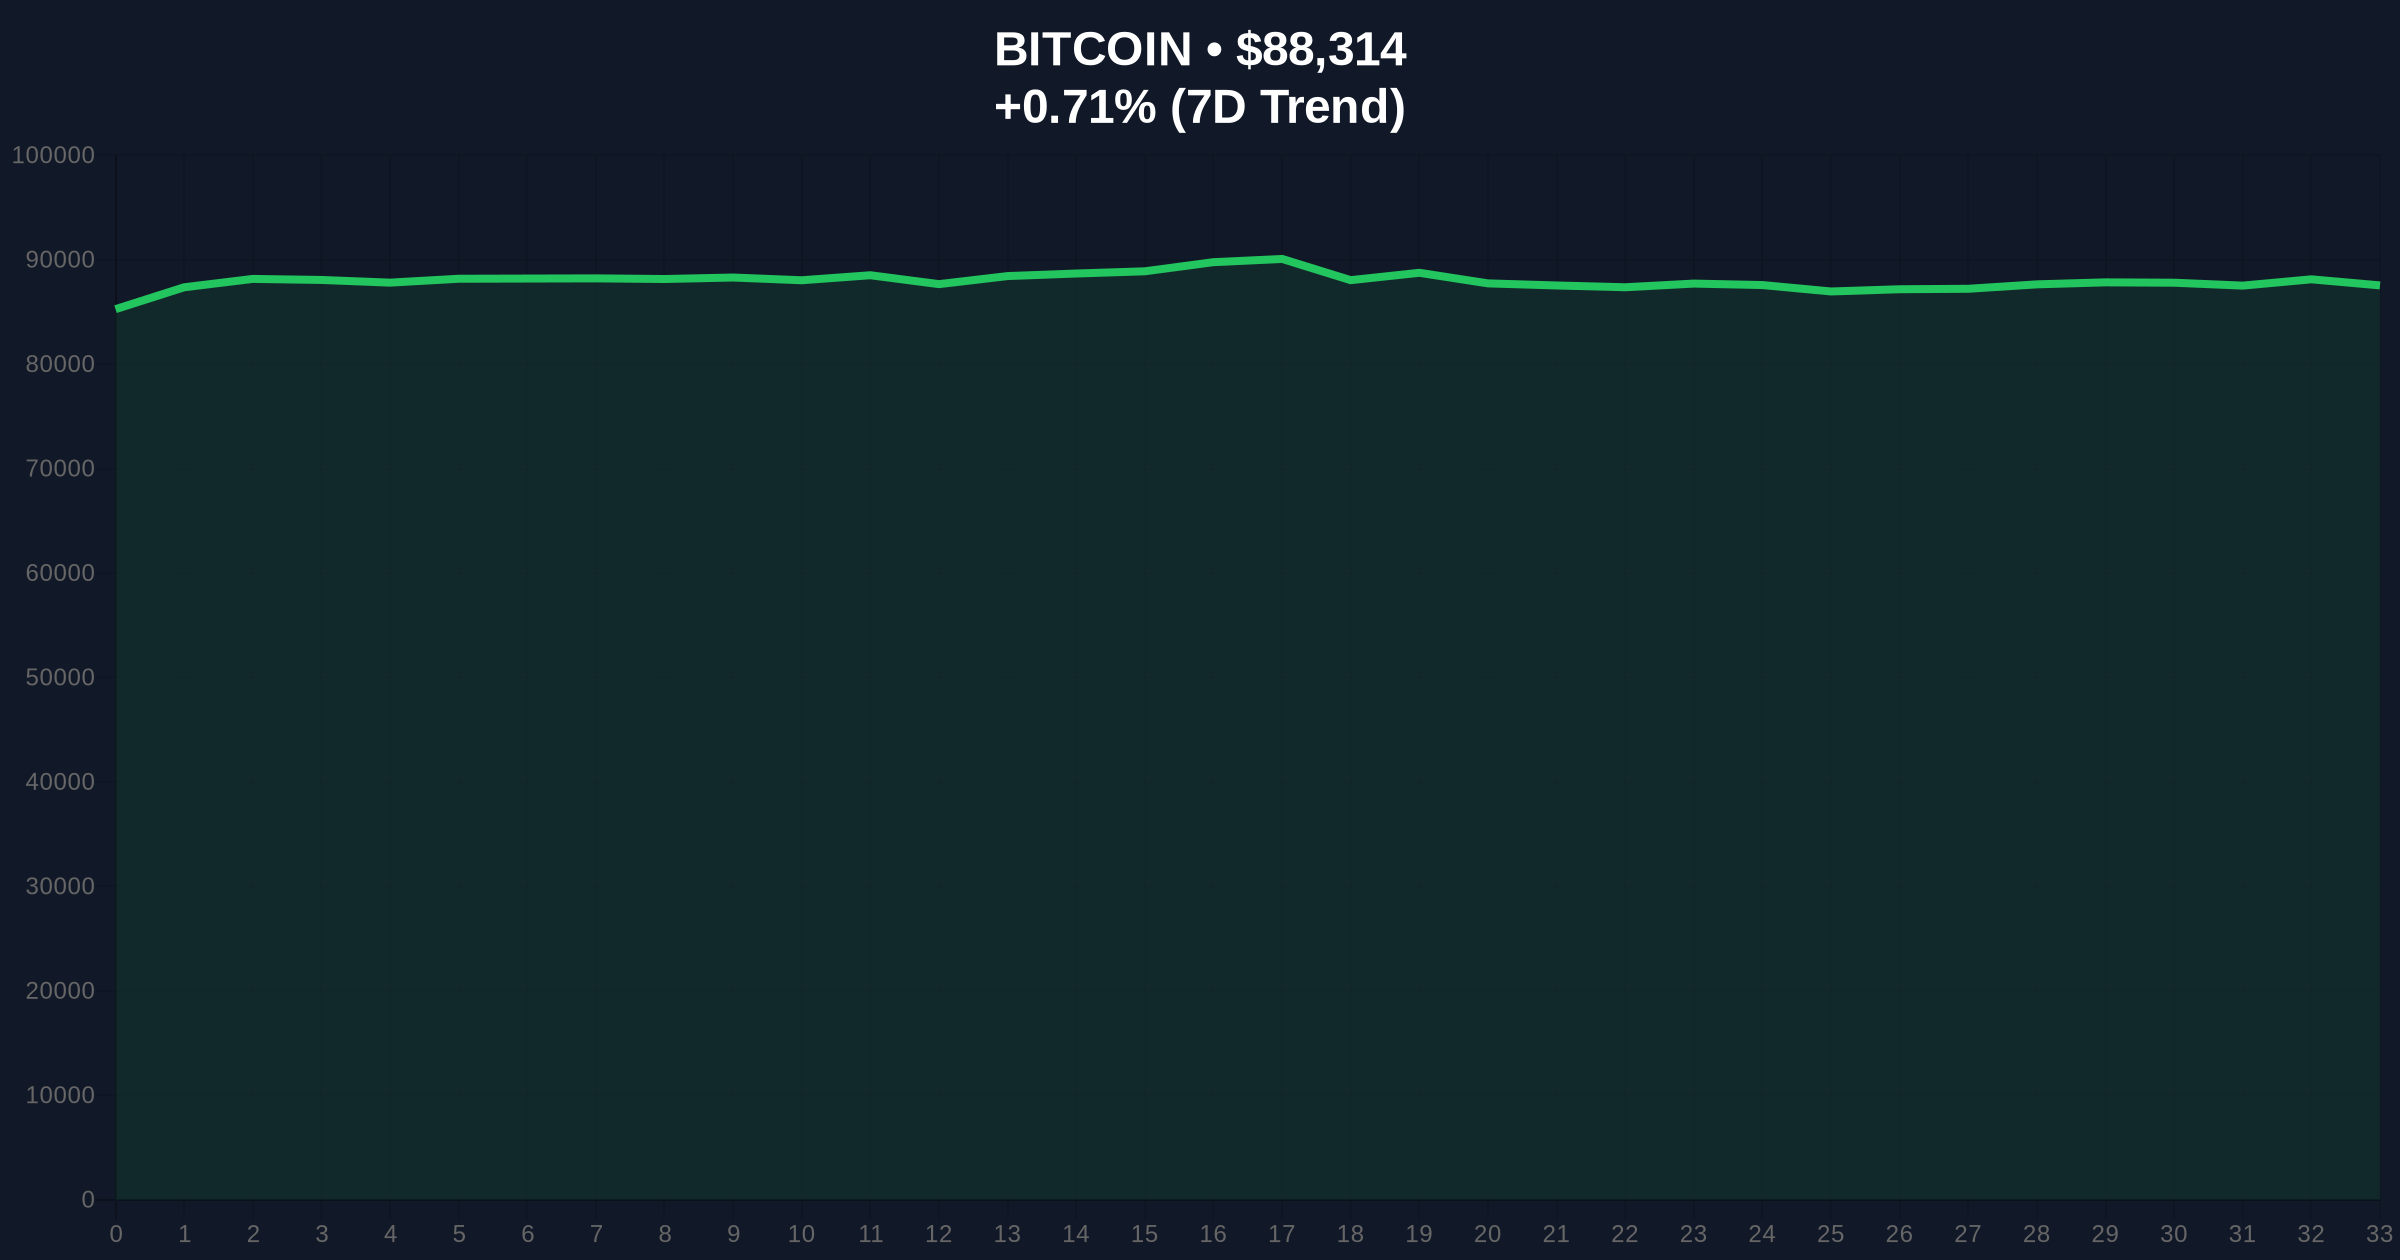
- Bitcoin price action pushes above $88,000 on Binance USDT market
- Global crypto sentiment registers "Extreme Fear" with score of 20/100
- Technical structure shows critical support at $85,200 Fibonacci level
- Market structure suggests potential liquidity grab above $89,500 resistance
VADODARA, December 26, 2025 — Bitcoin has broken through the $88,000 psychological barrier in a move that defies prevailing market sentiment, according to CoinNess market monitoring data. This daily crypto analysis examines the technical underpinnings of BTC's price action as it trades at $88,092.68 on the Binance USDT market while the broader cryptocurrency registers extreme fear levels.
Bitcoin's current price action occurs against a backdrop of institutional uncertainty and retail capitulation. The Global Crypto Fear & Greed Index has plunged to 20/100, indicating extreme fear among market participants. This sentiment divergence—where price action contradicts emotional indicators—often precedes significant directional moves. Historically, such extreme fear readings have coincided with accumulation phases for long-term holders, as evidenced during the 2018-2019 bear market bottom and the March 2020 COVID-19 crash. Underlying this trend is a fundamental tension between macroeconomic headwinds and Bitcoin's evolving store-of-value narrative. The Federal Reserve's ongoing balance sheet normalization, detailed in their latest balance sheet report, continues to pressure risk assets globally.
Related developments in the current market environment include analysis of Bitcoin's long-term value thesis under stress and examination of stable long-term holder flows despite price volatility.
According to CoinNess market monitoring, Bitcoin breached the $88,000 level during Thursday's trading session, reaching $88,092.68 on the Binance USDT market. This represents a 0.08% gain over the previous 24 hours, though price has since retraced to approximately $87,755 at time of analysis. The move occurred despite overwhelming negative sentiment across cryptocurrency markets, with the Fear & Greed Index registering just 20 out of 100 points. Market structure suggests this price action may represent a liquidity grab above recent consolidation ranges, targeting stop-loss orders clustered around psychological resistance levels.
Volume profile analysis indicates significant accumulation between $84,500 and $86,200, creating a potential order block that could serve as support on any retracement. The daily chart shows Bitcoin testing the 0.382 Fibonacci retracement level from the recent swing high at $92,500 to the swing low at $82,000, placing critical support at $85,200. The Relative Strength Index (RSI) on the 4-hour timeframe sits at 54, indicating neutral momentum with room for expansion in either direction. A cluster of exponential moving averages (20-day EMA at $86,800, 50-day EMA at $85,900, 200-day EMA at $83,400) provides dynamic support beneath current price action.
Market structure suggests two critical invalidation levels for traders. The bullish invalidation level sits at $85,200, representing the 0.382 Fibonacci support and the lower boundary of the recent accumulation zone. A break below this level would invalidate the current uptrend structure. The bearish invalidation level is established at $89,500, where significant resistance from previous swing highs converges with the 0.618 Fibonacci retracement level. A decisive break above this zone would signal continuation of the bullish impulse.
| Metric | Value |
| Current Bitcoin Price | $87,755 |
| 24-Hour Price Change | +0.08% |
| Global Crypto Sentiment Score | 20/100 (Extreme Fear) |
| Bitcoin Market Rank | #1 |
| Key Fibonacci Support | $85,200 (0.382 level) |
For institutional investors, this price action tests the resilience of Bitcoin's correlation breakdown narrative. The asset's ability to maintain price above $88,000 amid extreme fear sentiment suggests decoupling from traditional risk-on/risk-off dynamics. This has implications for portfolio allocation models that treat Bitcoin as a pure beta play. For retail participants, the extreme fear reading at 20/100 often signals capitulation phases where weak hands exit positions, potentially creating buying opportunities for disciplined investors. The technical structure around $85,200 support represents a critical level for both cohorts—a break below would trigger algorithmic selling from systematic strategies, while holding above could validate Bitcoin's store-of-value characteristics during market stress.
Market analysts on social platforms express cautious optimism despite the extreme fear reading. One quantitative trader noted, "The divergence between price action and sentiment metrics often precedes trend reversals. We're watching the $85,200 level as a make-or-break zone." Another observer highlighted the potential for a gamma squeeze if Bitcoin maintains momentum above $88,000, citing open interest concentrations in options markets. The prevailing view among technical analysts suggests this move represents a liquidity grab rather than a sustainable breakout, with several pointing to the plunging altcoin season index as evidence of capital rotation rather than broad market strength.
Bullish Case: Market structure suggests that holding above the $85,200 Fibonacci support could trigger a move toward $92,500 resistance. A decisive break above $89,500 would invalidate the bearish structure and potentially target the all-time high region around $94,000. This scenario requires sustained buying pressure and a shift in sentiment metrics from extreme fear to neutral or greedy territory.
Bearish Case: On-chain data indicates that failure to hold $85,200 support would likely trigger a retest of the $82,000 swing low. A break below this level would open the door to $78,500, where significant volume-based support resides. This scenario would be confirmed by increasing exchange inflows and declining network activity metrics.
What does Bitcoin breaking $88,000 mean for the market? The break above $88,000 represents a psychological victory for bulls but occurs amid extreme fear sentiment, creating a divergence that often precedes significant directional moves.
Why is crypto sentiment at extreme fear levels? Multiple factors contribute including macroeconomic uncertainty, regulatory developments, and technical breakdowns in altcoin markets that have spilled over to Bitcoin sentiment.
What are the key support levels for Bitcoin? Critical support exists at $85,200 (Fibonacci level), $84,500 (volume profile low), and $82,000 (recent swing low).
How does extreme fear sentiment affect price action? Historically, extreme fear readings often coincide with accumulation phases and potential reversal points, though they can also precede further declines if fundamental conditions deteriorate.
What technical indicators are most relevant now? Traders are watching the $85,200 Fibonacci support, RSI momentum on 4-hour charts, and the cluster of exponential moving averages between $83,400 and $86,800.
Source Note: Market data and factual reporting in this article are sourced from original reports. Commentary and analysis provided by CoinMarketBuzz.

Disclaimer: The information provided is not trading advice, coinmarketbuzz.com holds no liability for any investments made based on the information provided on this page. We strongly recommend independent research and/or consultation with a qualified professional before making any investment decisions.
coinmarketbuzz.com leverages advanced AI technology to analyze market data. All content is fact-checked and reviewed by our editorial team to ensure accuracy and neutrality.