Loading News...
Loading...
Loading News...

- Bitcoin breaks above $89,000 while Crypto Fear & Greed Index registers "Extreme Fear" at 20/100
- Technical structure suggests potential liquidity grab above $90,000 resistance zone
- Bullish invalidation at $85,200 (Fibonacci 0.618 retracement), bearish invalidation at $91,500
- Market structure contradicts sentiment data, raising questions about sustainability
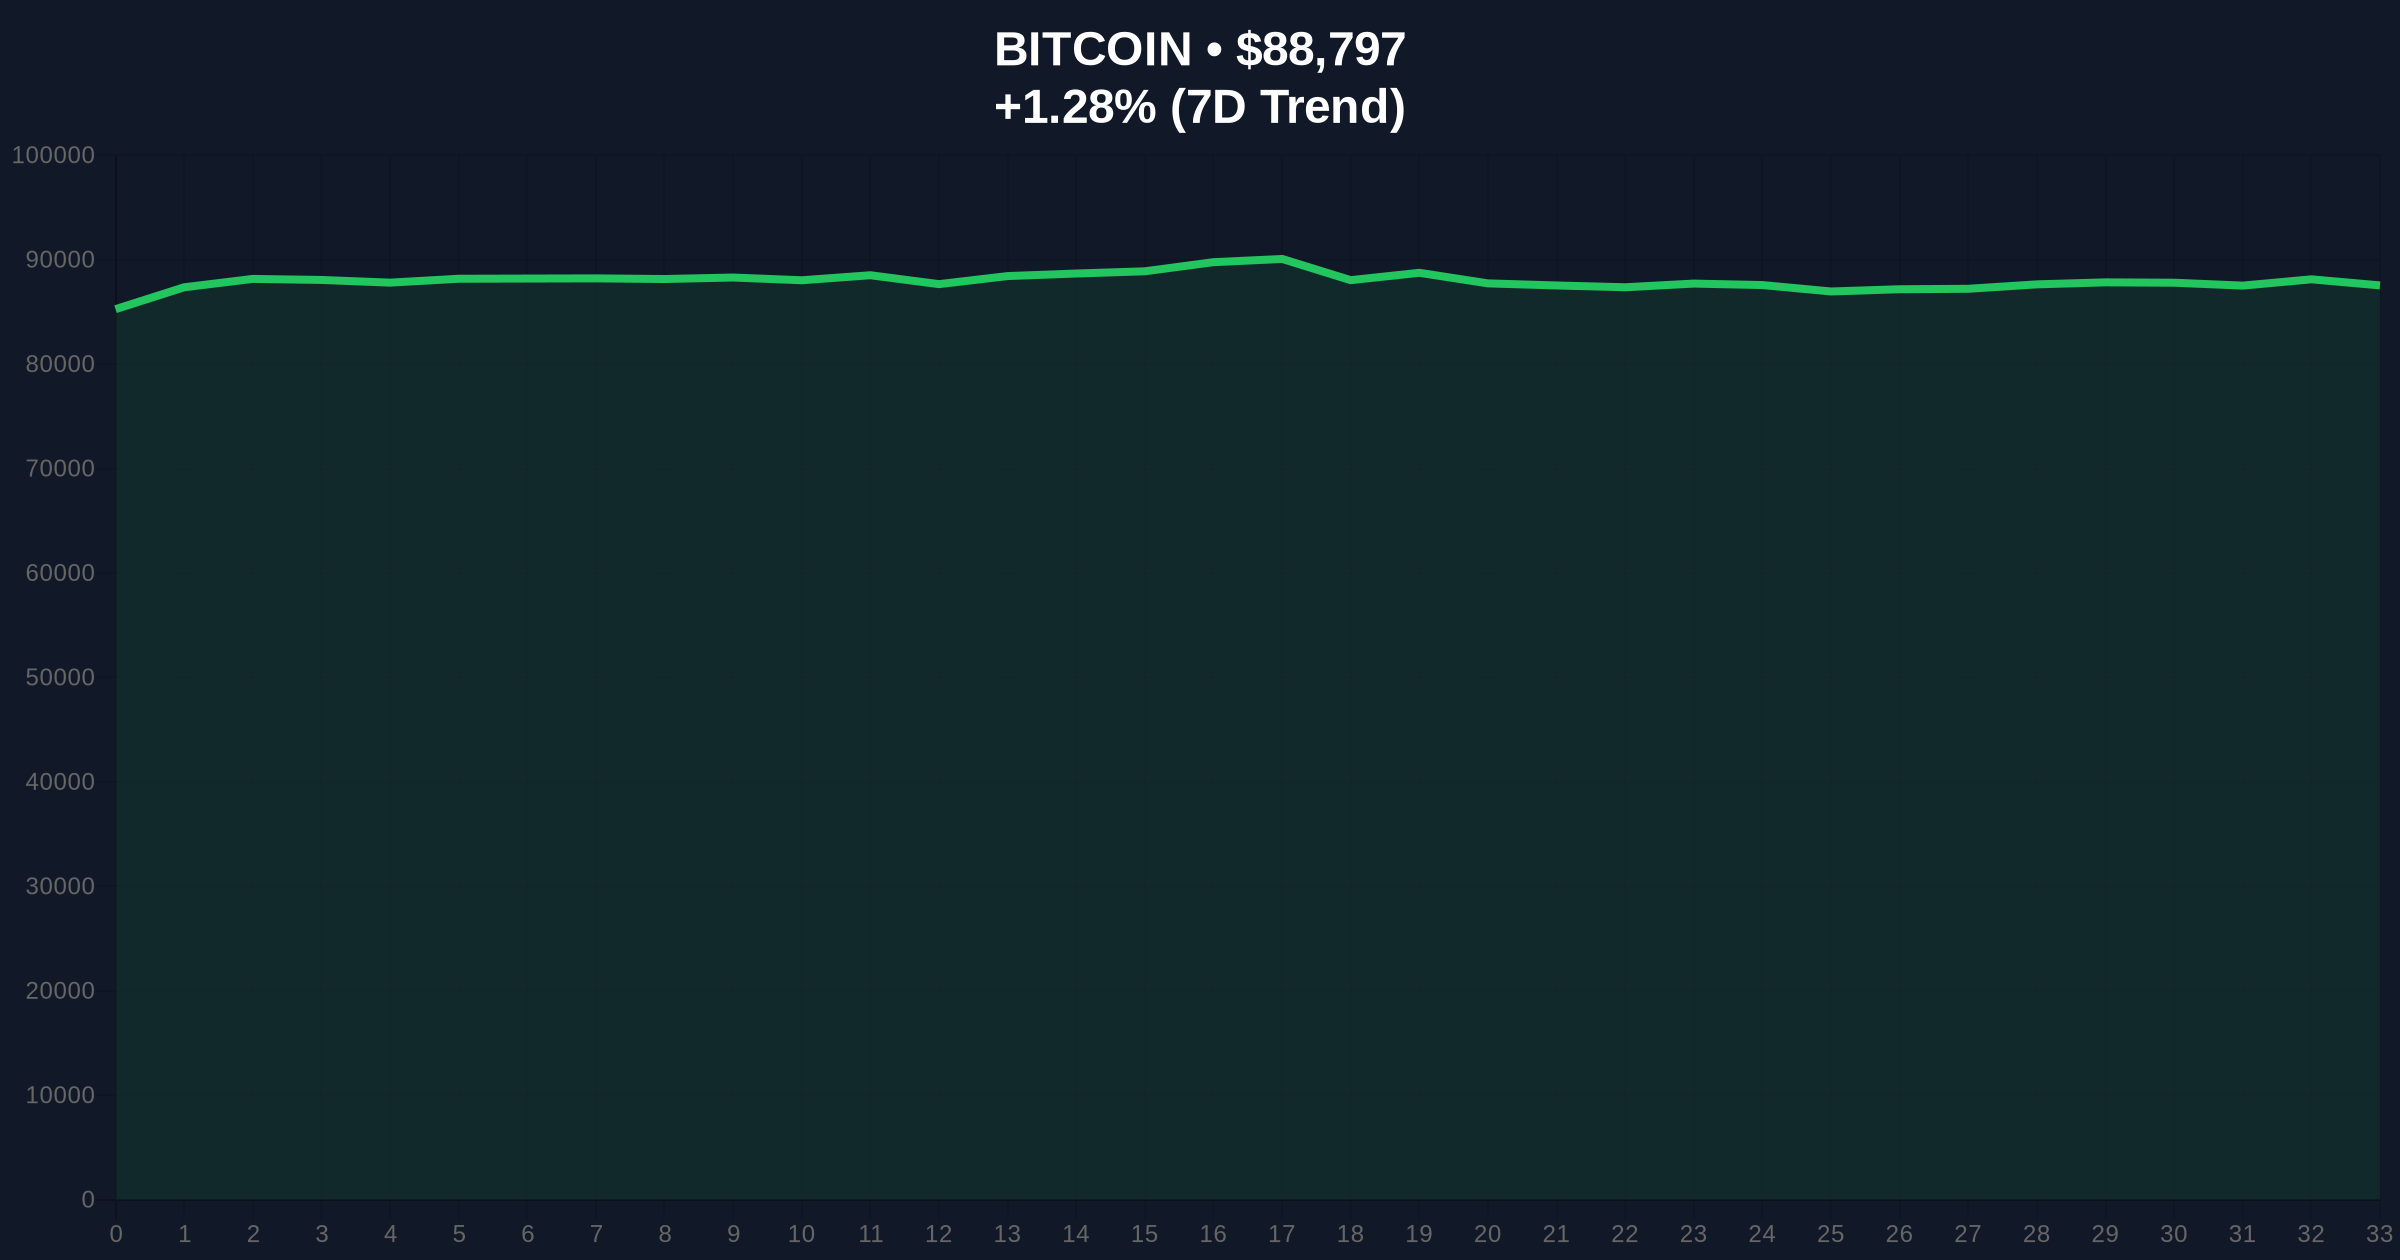
VADODARA, December 26, 2025 — Bitcoin has pushed above the $89,000 psychological level in what appears to be a classic liquidity grab, according to market monitoring data from CoinNess. This daily crypto analysis reveals a critical contradiction: while price action shows strength, the Crypto Fear & Greed Index sits at "Extreme Fear" with a score of 20/100. Market structure suggests this move may be testing the $90,000 resistance zone where significant sell-side liquidity resides.
This price action occurs against a backdrop of persistent market skepticism. The current "Extreme Fear" reading represents one of the most pronounced sentiment-price divergences since the 2022 bear market capitulation. Historical patterns indicate such extreme fear readings typically precede either violent reversals or sustained rallies, depending on whether they represent genuine capitulation or simply retail panic. The current move above $89,000 mirrors the liquidity-driven breakouts seen in early 2024, where price would surge into resistance zones only to retrace sharply. This context is particularly relevant given recent developments in market structure analysis, including the ongoing debate about institutional liquidity patterns highlighted in our coverage of large Coinbase deposits.
According to CoinNess market monitoring, BTC broke above the $89,000 threshold on December 26, 2025, trading at $89,043.34 on the Binance USDT market at the time of reporting. Real-time data shows the price has since consolidated around $88,850 with a 24-hour gain of 1.34%. This move represents a test of the upper boundary of a consolidation range that has persisted for approximately three weeks. The breakout occurred despite the Crypto Fear & Greed Index remaining firmly in "Extreme Fear" territory, creating what quantitative analysts refer to as a sentiment-price divergence. Market structure indicates this move may be targeting the liquidity pool above $90,000, where numerous stop-loss orders and leveraged long positions are likely clustered.
The current price action reveals several critical technical levels. The $90,000 zone represents a major resistance confluence, combining a psychological round number with the 0.786 Fibonacci extension from the recent swing low. Volume profile analysis shows diminished participation on this move, suggesting institutional accumulation may be limited. The Relative Strength Index (RSI) sits at 62 on the daily timeframe, indicating neutral momentum rather than overbought conditions. The 50-day moving average at $86,500 provides dynamic support, while the 200-day moving average at $82,000 represents the primary trend confirmation level. A critical Fair Value Gap (FVG) exists between $87,200 and $87,800 that price may need to revisit for structural integrity. Market structure suggests this move could be testing an Order Block around $90,500 where previous distribution occurred.
| Metric | Value |
|---|---|
| Current Bitcoin Price | $88,850 |
| 24-Hour Change | +1.34% |
| Crypto Fear & Greed Index | 20/100 (Extreme Fear) |
| Market Rank | #1 |
| Key Resistance Level | $90,000 |
For institutional investors, this price-sentiment divergence represents either a significant opportunity or a potential trap. The extreme fear reading suggests retail participants remain skeptical despite price appreciation, which could indicate underlying strength if institutions are accumulating against retail sentiment. However, the technical structure suggests this may be a liquidity grab targeting the $90,000 zone where stop-loss orders and leveraged positions create attractive liquidation targets. For retail traders, the critical question is whether this represents genuine breakout confirmation or simply a bull trap. The sustainability of this move will depend on whether price can establish acceptance above $89,500 and convert it from resistance to support.
Market analysts on social platforms express divided opinions. Some point to the extreme fear reading as a contrarian bullish signal, suggesting "when everyone is fearful, it's time to be greedy." Others highlight the technical structure, noting that "price is approaching a major liquidity zone where we've seen reversals before." The absence of significant buying volume on this move raises questions about whether this represents genuine accumulation or simply short covering. As noted in our analysis of Bitcoin's long-term value thesis, these sentiment extremes often test fundamental convictions.
Bullish Case: If Bitcoin establishes acceptance above $90,000 with increasing volume, the next target becomes the $95,000 psychological level. This scenario would require the extreme fear reading to transition toward neutral or greedy territory, confirming genuine accumulation. The bullish invalidation level sits at $85,200, representing the 0.618 Fibonacci retracement of the recent move. A hold above this level would maintain the bullish structure.
Bearish Case: If this represents a liquidity grab into the $90,000 resistance zone, expect a rejection and retracement toward the $85,000 support level. The bearish invalidation level is $91,500; a break above this would negate the immediate bearish scenario. This could trigger what options traders refer to as a gamma squeeze if short positions are forced to cover, though current options data doesn't support this thesis. The extreme fear sentiment could worsen if price fails to hold gains, potentially testing the $82,000 200-day moving average support.
What does "Extreme Fear" mean for Bitcoin price? The Crypto Fear & Greed Index at 20/100 indicates overwhelming negative sentiment among retail traders. Historically, such extremes have preceded major moves in either direction, depending on whether they represent capitulation or simply panic.
Why is Bitcoin rising despite extreme fear? This divergence suggests institutional accumulation may be occurring against retail sentiment, or that the move represents a liquidity grab targeting stop-loss orders above key resistance levels.
What is a liquidity grab in crypto trading? A liquidity grab occurs when price moves toward areas where stop-loss orders or leveraged positions are concentrated, allowing market makers or large participants to execute trades at favorable prices before reversing direction.
What are the key levels to watch for Bitcoin? Critical levels include resistance at $90,000, support at $85,200 (bullish invalidation), and the 200-day moving average at $82,000. A break above $91,500 would invalidate immediate bearish scenarios.
How does this relate to broader market conditions? This price action occurs amid broader market uncertainty, with altcoins underperforming as highlighted in our coverage of the Altcoin Season Index. The concentration in Bitcoin suggests risk-off behavior despite the price appreciation.
Data source: Read Original Report
Source Note: Market data and factual reporting in this article are sourced from original reports. Commentary and analysis provided by CoinMarketBuzz.

Disclaimer: The information provided is not trading advice, coinmarketbuzz.com holds no liability for any investments made based on the information provided on this page. We strongly recommend independent research and/or consultation with a qualified professional before making any investment decisions.
coinmarketbuzz.com leverages advanced AI technology to analyze market data. All content is fact-checked and reviewed by our editorial team to ensure accuracy and neutrality.