Loading News...
Loading...
Loading News...

- On-chain analyst Ali Martinez identifies Bitcoin's historical 1,064-day bottom-to-peak cycle, suggesting potential 2026 all-time high.
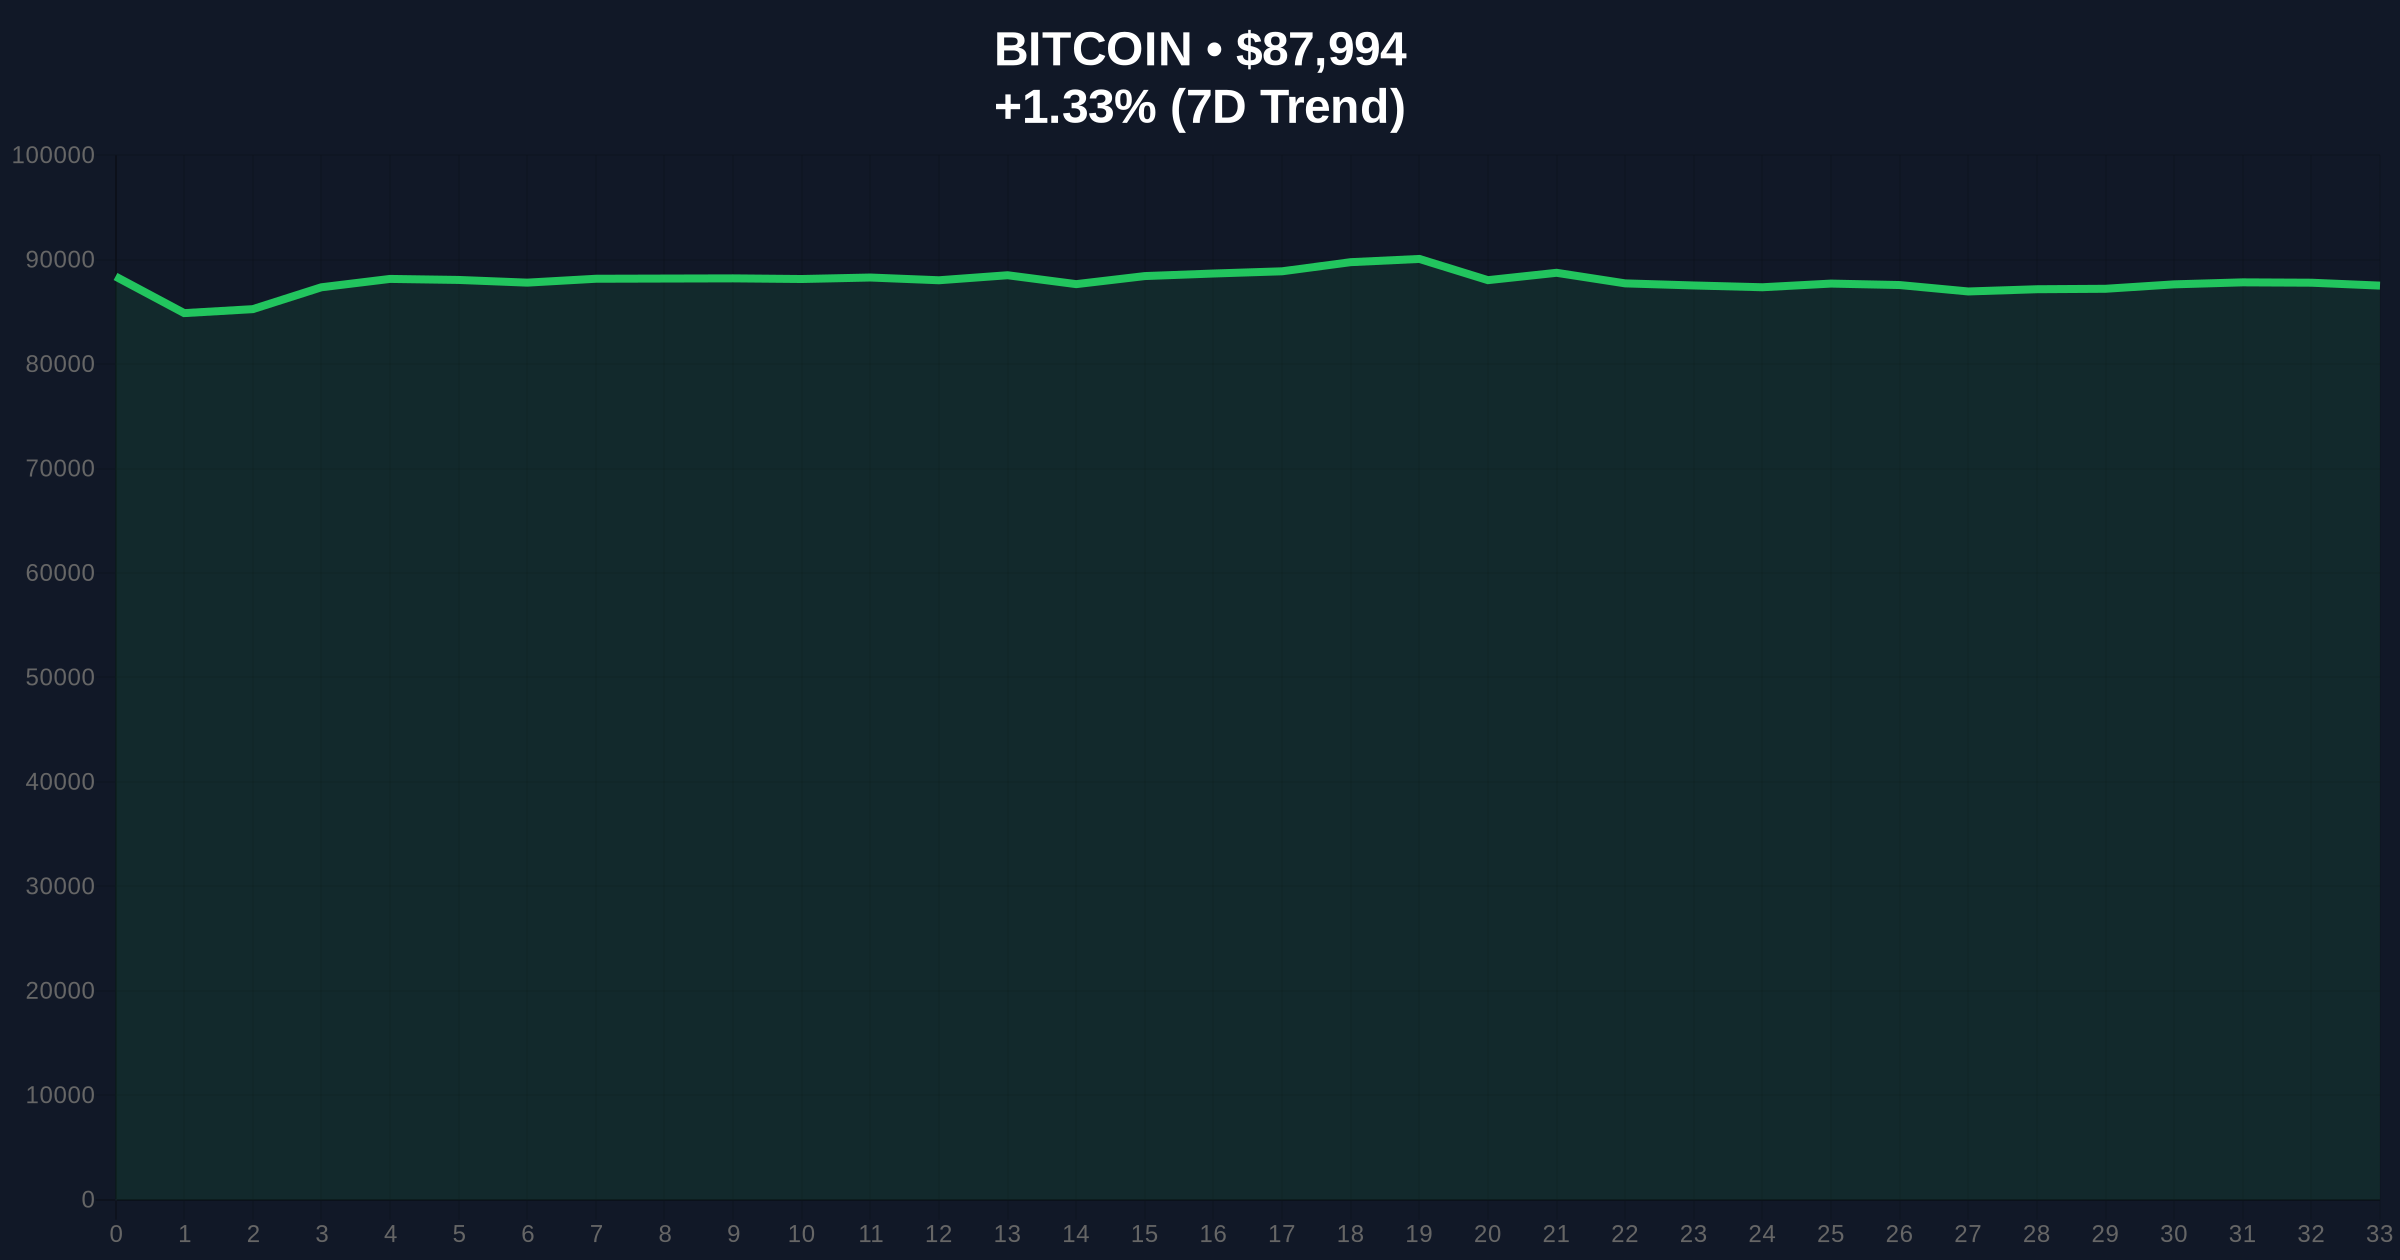
- Current market structure shows Bitcoin trading at $88,027 with extreme fear sentiment (23/100) despite 1.36% daily gain.
- Technical analysis identifies critical support at $82,000 (Fibonacci 0.618 level) and resistance at $92,000 (previous order block).
- Market structure suggests current consolidation represents accumulation phase before next cycle acceleration.
VADODARA, December 25, 2025 — On-chain analyst Ali Martinez's identification of Bitcoin's 1,064-day historical cycle from market bottom to peak provides a mathematical framework for this daily crypto analysis, suggesting potential 2026 all-time highs. Market structure currently shows Bitcoin trading at $88,027 with extreme fear sentiment dominating despite a 1.36% daily gain, creating what quantitative analysts recognize as a potential liquidity grab opportunity.
Bitcoin's cyclical behavior has been documented since its inception, with each halving event historically triggering multi-year bull markets. The current cycle analysis follows the November 2022 bottom at approximately $15,500, placing the market approximately 1,100 days into what Martinez identifies as a typical 1,064-day bottom-to-peak trajectory. This pattern mirrors the 2015-2017 and 2018-2021 cycles, where Bitcoin experienced exponential growth following extended accumulation phases. Underlying this trend is the fundamental scarcity mechanism encoded in Bitcoin's protocol, which creates predictable supply shocks every four years. The Federal Reserve's monetary policy decisions, particularly regarding interest rates, have historically correlated with crypto market liquidity conditions, though Bitcoin's cyclicality appears increasingly decoupled from traditional financial markets.
Related developments in the broader cryptocurrency ecosystem include regulatory shifts affecting market structure. For instance, Russian exchanges preparing for regulated trading by 2026 could impact global liquidity flows, while derivatives market contradictions revealed in recent reports highlight growing institutional participation despite retail fear sentiment.
On December 25, 2025, on-chain analyst Ali Martinez published data on X indicating Bitcoin's historical cycle duration. According to his analysis, Bitcoin has taken approximately 1,064 days to move from market bottom to peak across previous cycles, with the subsequent decline from peak to new bottom averaging 364 days. Martinez's data points were derived from on-chain metrics including realized price, MVRV ratios, and long-term holder behavior patterns. This analysis emerges as Bitcoin trades at $88,027, representing a 1.36% gain over the past 24 hours despite the Crypto Fear & Greed Index registering "Extreme Fear" at 23/100. The current price action occurs within what technical analysts identify as a consolidation range between $82,000 and $92,000, with volume profile analysis showing decreasing volatility as the market digests recent moves.
Market structure suggests Bitcoin is currently testing a critical order block between $86,500 and $89,000, where previous liquidity was taken during the November 2024 rally. The daily chart shows a series of higher lows since the 2022 bottom, with the 200-day moving average providing dynamic support at $78,500. Relative Strength Index (RSI) readings at 54 indicate neutral momentum, neither overbought nor oversold, suggesting room for movement in either direction. A significant fair value gap (FVG) exists between $84,000 and $86,000 from the December 15th gap down, which market makers will likely target for liquidity. Fibonacci retracement levels from the 2022 low to 2024 high identify $82,000 as the 0.618 support level, while extension targets suggest $125,000 as a potential 1.618 Fibonacci extension if the cycle continues according to historical patterns.
Bullish invalidation occurs below $78,000, where the 200-day moving average and volume profile point of control converge, suggesting structural breakdown. Bearish invalidation occurs above $95,000, where previous resistance from the April 2024 peak would indicate cycle acceleration beyond historical norms.
| Metric | Value |
|---|---|
| Bitcoin Current Price | $88,027 |
| 24-Hour Change | +1.36% |
| Market Cap Rank | #1 |
| Fear & Greed Index | 23/100 (Extreme Fear) |
| Historical Bottom-to-Peak Days | 1,064 |
| Peak-to-Bottom Days | 364 |
For institutional investors, the 1,064-day cycle provides a quantitative framework for capital allocation timing, suggesting the current phase represents late-cycle accumulation before potential 2026 distribution. Portfolio managers can use this data to optimize entry points while managing duration risk. Retail traders face different implications: the extreme fear sentiment at 23/100 typically precedes significant moves, either as capitulation or reversal, creating asymmetric risk/reward scenarios. The cycle analysis matters because it transcends short-term noise, offering a multi-year perspective that aligns with Bitcoin's fundamental scarcity schedule. Market structure suggests institutions are accumulating during this fear phase, as evidenced by stablecoin inflows to exchanges and decreasing exchange balances, while retail sentiment remains pessimistic—a classic contrarian indicator.
Market analysts on X have responded to Martinez's data with mixed interpretations. Bulls emphasize the mathematical precision of the 1,064-day pattern, suggesting "the clock is ticking toward 2026 fireworks." Others caution that past performance doesn't guarantee future results, noting regulatory uncertainties and macroeconomic headwinds. Quantitative traders are particularly focused on the 364-day peak-to-bottom average, which would imply a relatively short bear market following the next peak—a pattern that contradicts traditional financial asset behavior. The extreme fear sentiment reading has sparked debates similar to those seen during previous cycle transitions, with some drawing parallels to recent contrarian discussions around bear market predictions.
Bullish Case: If Bitcoin follows the historical 1,064-day pattern from the November 2022 bottom, the cycle would peak around late 2025 to mid-2026. Technical targets include the $125,000 Fibonacci extension level, with potential acceleration toward $150,000 if institutional adoption accelerates through vehicles like spot ETFs. On-chain data indicates decreasing exchange balances and increasing long-term holder accumulation, supporting this scenario. The bullish case remains valid above the $78,000 invalidation level.
Bearish Case: Cycle breakdown could occur if macroeconomic conditions deteriorate significantly, with the Federal Reserve maintaining restrictive policy beyond market expectations. A break below $78,000 would invalidate the higher low structure, potentially triggering a retest of the $65,000 support zone. Regulatory developments, particularly regarding cryptocurrency classification and taxation, could extend cycle duration beyond historical norms. The bearish case gains credibility if Bitcoin fails to reclaim $92,000 resistance in the coming weeks.
What is the 1,064-day Bitcoin cycle? The 1,064-day cycle refers to historical data showing Bitcoin takes approximately three years from market bottom to peak across previous bull markets.
How does current price action fit the cycle theory? Bitcoin is approximately 1,100 days from its November 2022 bottom, slightly ahead of the historical average, suggesting potential cycle compression or acceleration.
What is extreme fear sentiment telling us? The 23/100 Fear & Greed Index reading typically occurs near market turning points, either as capitulation before rallies or distribution before declines.
How reliable are historical cycles for prediction? While past patterns provide probabilistic frameworks, they don't guarantee future outcomes. Each cycle operates within unique macroeconomic and regulatory contexts.
What technical levels matter most right now? Critical levels include $82,000 Fibonacci support, $92,000 resistance, and the $78,000 invalidation level where market structure would break.
Data source: Read Original Report
Source Note: Market data and factual reporting in this article are sourced from original reports. Commentary and analysis provided by CoinMarketBuzz.

Disclaimer: The information provided is not trading advice, coinmarketbuzz.com holds no liability for any investments made based on the information provided on this page. We strongly recommend independent research and/or consultation with a qualified professional before making any investment decisions.
coinmarketbuzz.com leverages advanced AI technology to analyze market data. All content is fact-checked and reviewed by our editorial team to ensure accuracy and neutrality.