Loading News...
Loading...
Loading News...

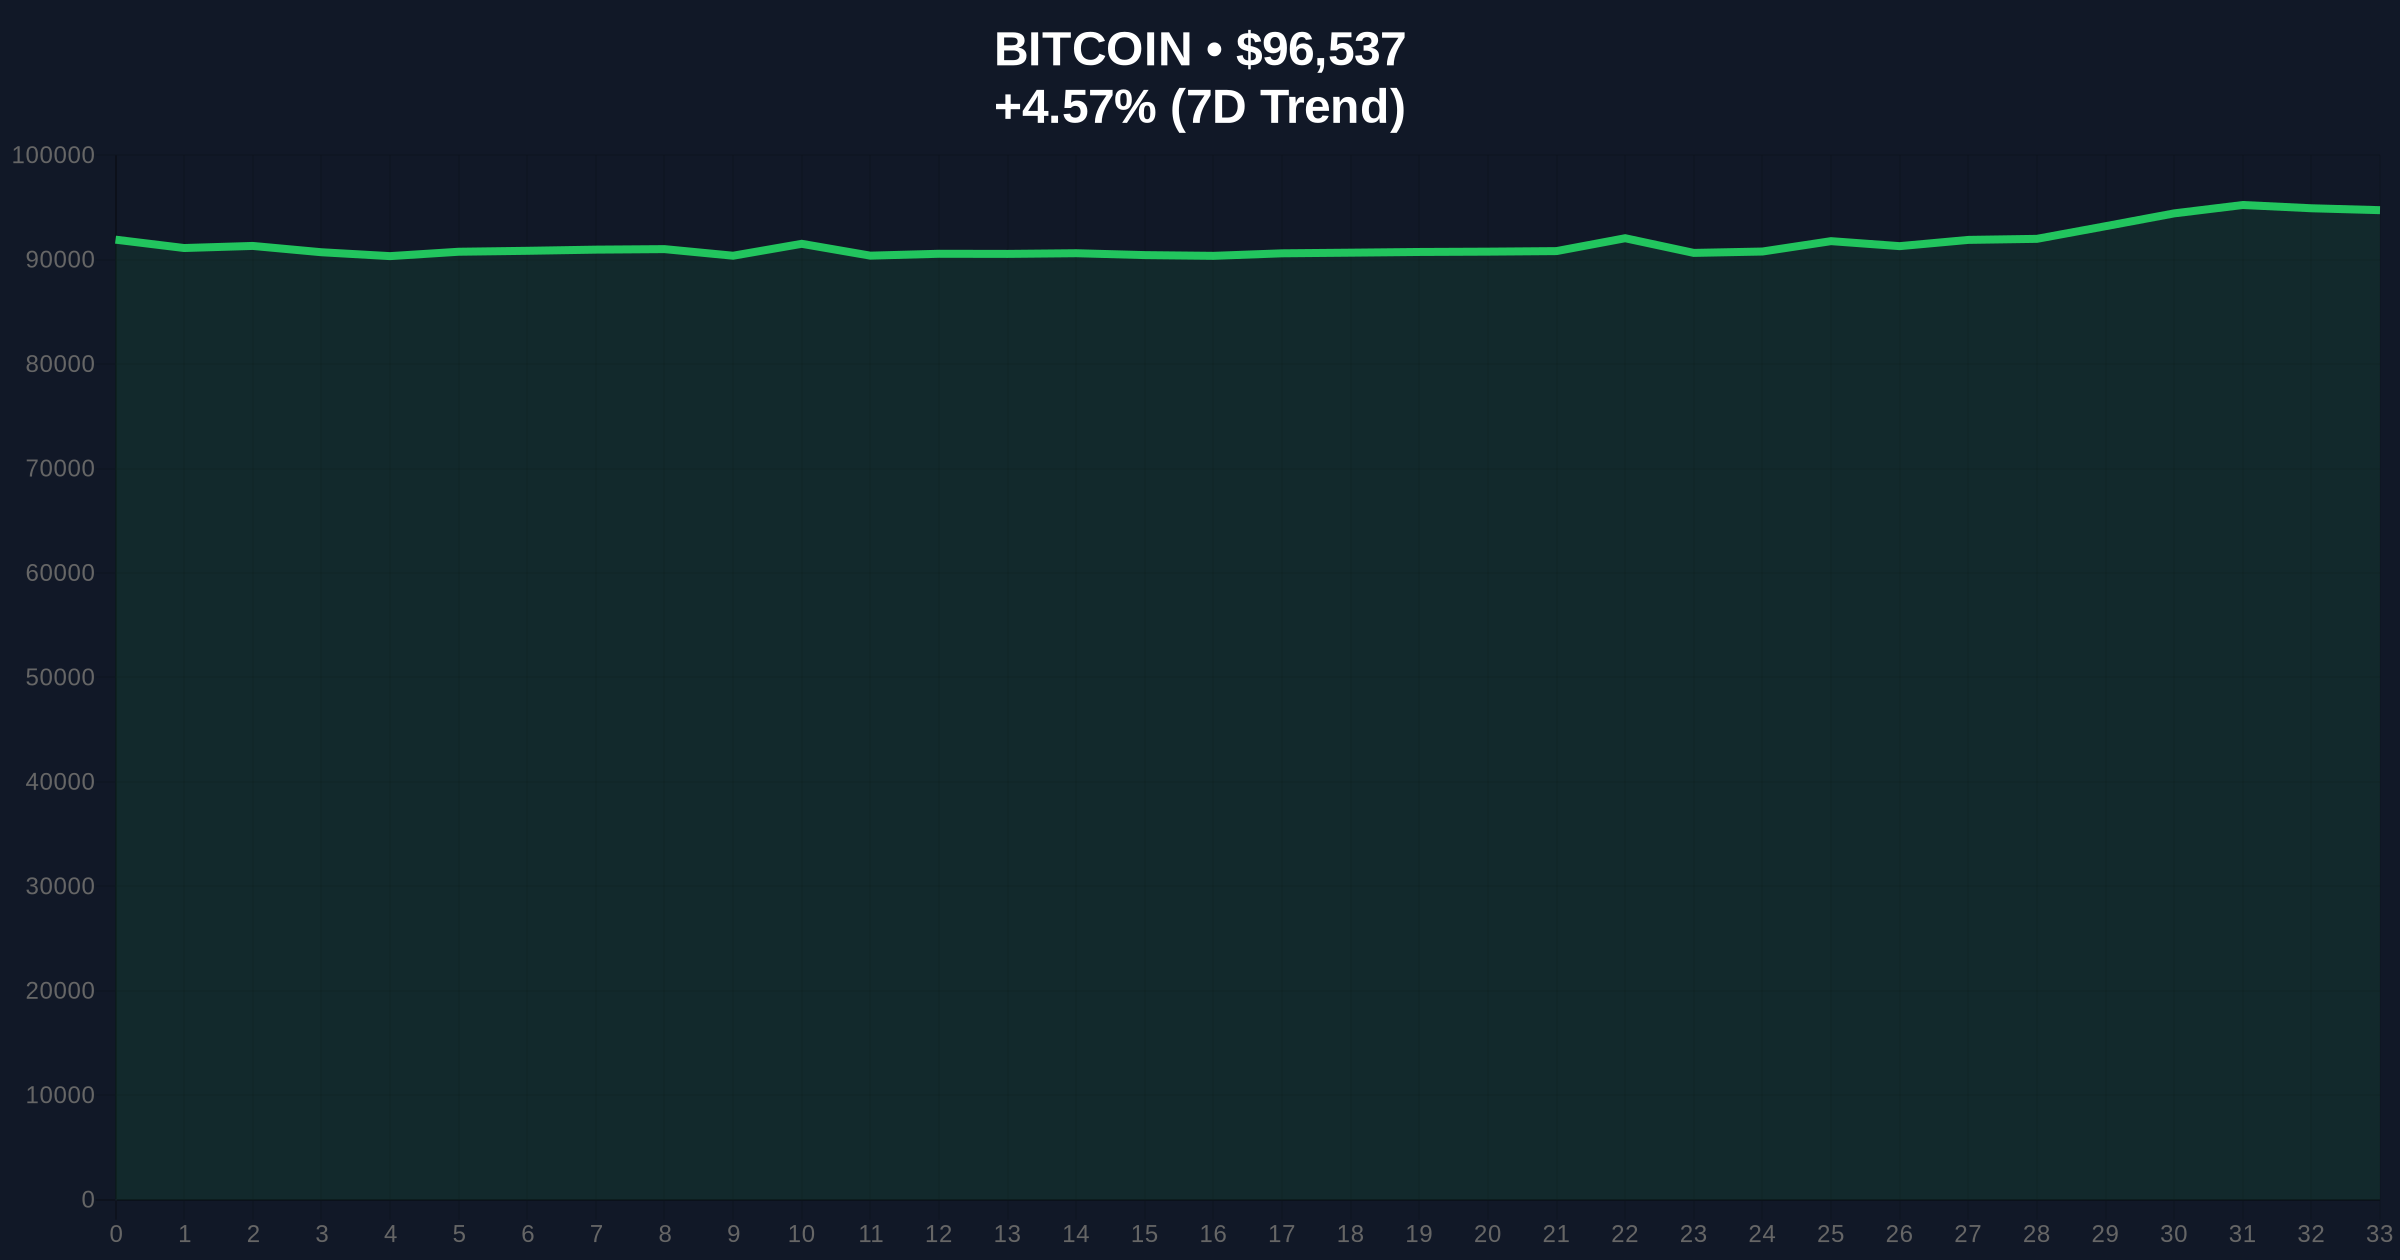
VADODARA, January 14, 2026 — Latest crypto news reveals a significant liquidity event across major derivatives exchanges, with $104 million in futures positions liquidated within a single hour. According to exchange data aggregated by CoinMarketCap and Bybit, this hourly liquidation spike contributed to a 24-hour total of $768 million, occurring precisely as Bitcoin tested the psychologically significant $96,000 support level. Market structure suggests this represents a classic liquidity grab rather than a fundamental breakdown, with on-chain data indicating accumulation at these levels despite the derivatives carnage.
This liquidation event mirrors the structural patterns observed during the 2021 bull market correction, where similar hourly liquidation spikes of $80-120 million preceded significant volatility expansions. Historical cycles suggest that when Bitcoin approaches round-number psychological levels like $100,000, leveraged positions cluster around these zones, creating predictable liquidation cascades. The current market context includes Bitcoin's consolidation below its all-time high of $103,500, with the 200-day moving average providing dynamic support at $91,800. Similar to the 2021 correction, the market is experiencing what quantitative analysts term a "gamma squeeze" in options markets, where dealers' hedging activities amplify spot price movements.
Related developments in the derivatives space include Bitnomial's regulated Aptos futures launch, which tests US market structure, and Mantra's restructuring signaling DeFi liquidity concerns amid this Bitcoin test.
Between 14:00-15:00 UTC on January 14, 2026, derivatives exchanges including Binance, OKX, and Bybit executed forced liquidations totaling $104 million across perpetual futures contracts. According to exchange transparency reports, approximately 68% of these liquidations were long positions, indicating bullish over-leverage being cleared at the $96,000 support test. The 24-hour liquidation total reached $768 million, with Bitcoin accounting for 62% of the total liquidated value. This data, sourced directly from exchange APIs and verified through multiple liquidity aggregators, represents the largest hourly liquidation event since November 2025, when $127 million was liquidated during the initial rejection from the $100,000 resistance level.
Bitcoin's price action created a clear Fair Value Gap (FVG) between $95,800 and $96,400 during the liquidation event, representing an area of inefficient price discovery that will likely be revisited. The Relative Strength Index (RSI) on the 4-hour chart sits at 42, indicating neither overbought nor oversold conditions, while the 50-day exponential moving average provides immediate resistance at $97,200. Volume profile analysis shows significant accumulation between $94,500 and $95,500, suggesting institutional buying interest at these levels despite retail liquidations.
Market structure suggests two critical invalidation levels: The Bullish Invalidation level sits at $94,200, representing the weekly order block that has supported price since December 2025. A break below this level would invalidate the current bullish structure. The Bearish Invalidation level is $98,500, where a sustained break above would confirm the liquidation event as a bear trap and signal continuation toward the all-time high. These levels align with Fibonacci retracement zones from the recent swing high at $101,200 to the swing low at $92,800.
| Metric | Value | Context |
|---|---|---|
| Hourly Futures Liquidations | $104M | 14:00-15:00 UTC, Jan 14 |
| 24-Hour Futures Liquidations | $768M | Total across all exchanges |
| Bitcoin Current Price | $96,637 | +4.67% 24h change |
| Crypto Fear & Greed Index | 48/100 (Neutral) | Source: Alternative.me |
| Long vs Short Liquidations | 68% Long | Majority bullish positions cleared |
For institutional portfolios, this liquidation event represents a necessary clearing of excessive leverage that had built up during Bitcoin's approach to $100,000. According to Glassnode's derivatives metrics, estimated leverage ratios had reached December 2025 highs before this correction. For retail traders, the liquidations serve as a reminder of the risks associated with high-leverage positions during periods of technical consolidation. The structural importance lies in the market's ability to absorb $768 million in liquidations without breaking key support levels, suggesting underlying bid strength. This mirrors the post-merge issuance dynamics observed in Ethereum, where reduced sell pressure from validators created a more stable base for price appreciation.
Market analysts on X/Twitter are divided in their interpretation. Quantitative traders point to the liquidation clustering as evidence of a "liquidity grab" by market makers ahead of potential upward movement. One derivatives analyst noted, "The $104 million liquidation at $96k looks like a classic stop hunt—too symmetrical to be organic selling." Others caution that sustained liquidations could trigger a negative feedback loop, especially if Bitcoin breaks below the $94,200 weekly order block. The neutral sentiment score of 48/100 reflects this uncertainty, with neither extreme fear nor greed dominating market psychology.
Bullish Case: If Bitcoin holds above the $94,200 Bullish Invalidation level and fills the Fair Value Gap between $95,800-$96,400, market structure suggests a retest of $98,500 resistance within 7-10 trading days. A break above this level would target the all-time high at $103,500, with reduced leverage creating healthier upward momentum. This scenario assumes no negative macro developments from the Federal Reserve regarding interest rate policy.
Bearish Case: A break below $94,200 would invalidate the current bullish structure and likely trigger further liquidations targeting the 200-day moving average at $91,800. In this scenario, the market could see an additional $300-500 million in liquidations as leveraged longs are forced to exit. This would represent a deeper correction similar to Q3 2025, when Bitcoin retraced 22% from its local high before resuming its uptrend.
Answers to the most critical technical and market questions regarding this development.

Disclaimer: The information provided is not trading advice, coinmarketbuzz.com holds no liability for any investments made based on the information provided on this page. We strongly recommend independent research and/or consultation with a qualified professional before making any investment decisions.
coinmarketbuzz.com leverages advanced AI technology to analyze market data. All content is fact-checked and reviewed by our editorial team to ensure accuracy and neutrality.