Loading News...
Loading...
Loading News...

VADODARA, April 15, 2026. The following report is based on currently available verified source material and market data.
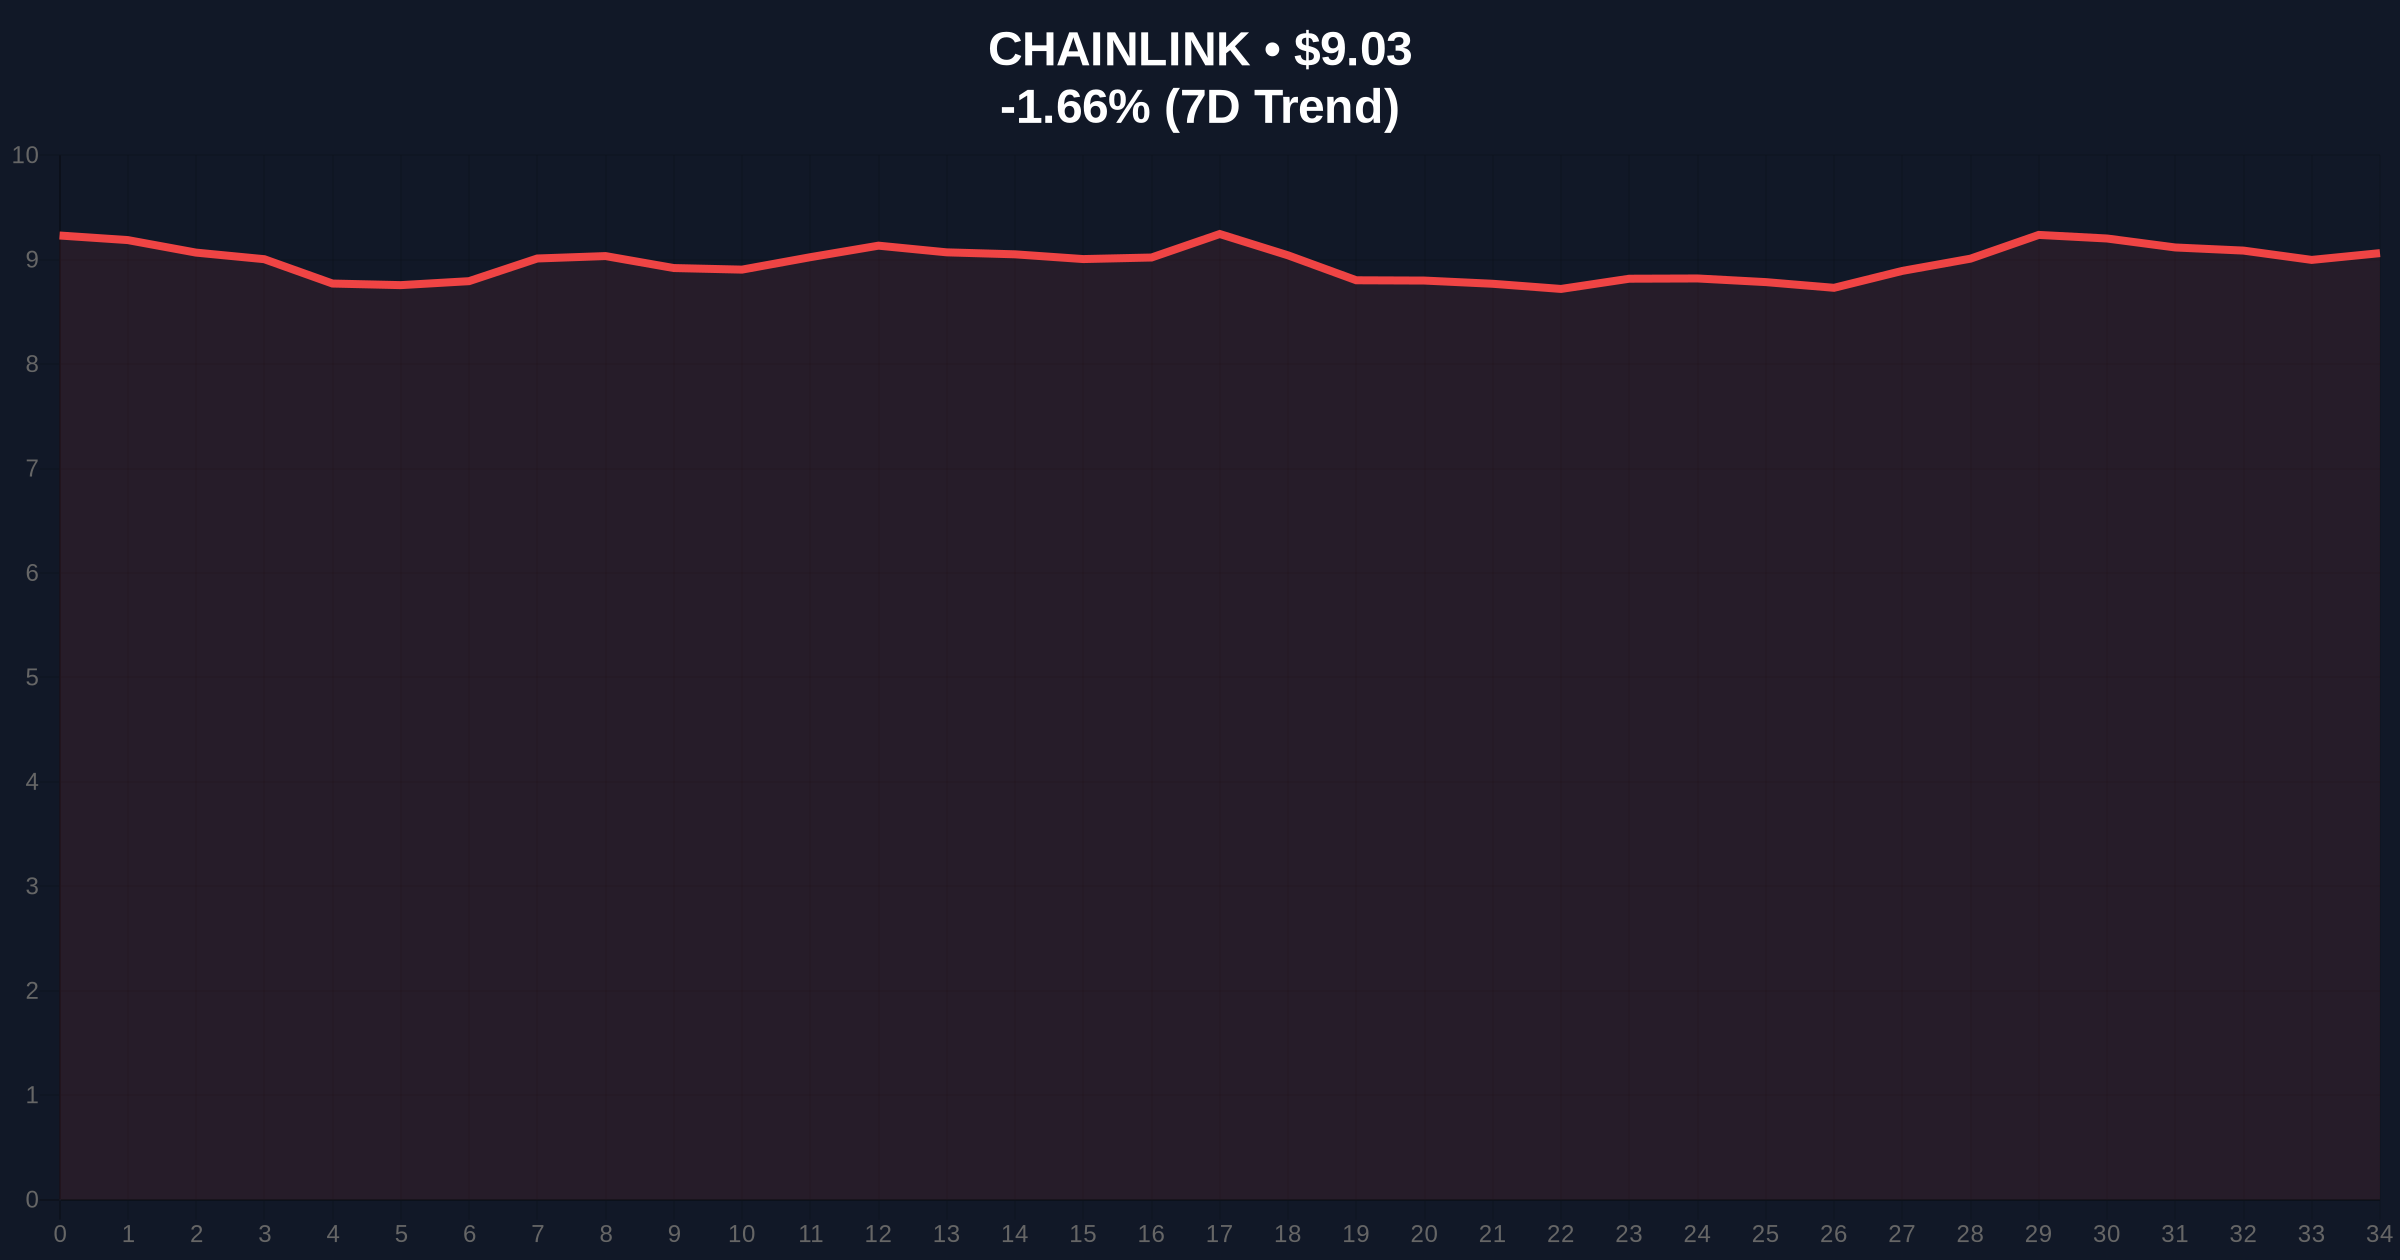
As of April 15, 2026, Chainlink (LINK) price remains capped below the $10 resistance, trading within a tight horizontal range between $8.4 and $9.6 while forming higher lows in an ascending channel. This compression structure signals controlled bullish pressure but weak momentum, leaving traders questioning whether a breakout or breakdown is imminent. The current market impact shows LINK at $9.03 with a 24-hour decline of 1.82%, reflecting broader crypto sentiment in "Extreme Fear" territory, which influences accumulation patterns and range-bound behavior.
Chainlink's price action reveals specific metrics critical for understanding its current state. The token is stabilizing below the psychological $10 barrier, with key support at $8.4 and resistance at $9.6. Recent volatility included a slide from $9.30 to $8.70 due to heavy selling pressure, but higher lows indicate underlying demand. Technical indicators like RSI forming higher lows and MACD curling upward near the zero line suggest a gradual shift toward buyers, though confirmation requires a break above $10 or below $8.4.
| Metric | Value | Source |
|---|---|---|
| Current Price | $9.03 | Source: CoinGecko |
| 24h Trend | -1.82% | Source: CoinGecko |
| Market Rank | #17 | Source: CoinGecko |
| Key Resistance | $9.6, $10 | Source: public statement |
| Key Support | $8.4 | Source: public statement |
| Global Crypto Sentiment | Extreme Fear (Score: 23/100) | Source: CoinGecko |
This situation matters for four key reasons. First, why now? The compression occurs amid "Extreme Fear" sentiment, similar to accumulation phases in past cycles like 2021, where range-bound trading preceded major moves. Second, who benefits? Range traders and accumulators benefit from predictable volatility, while weak hands face liquidation risks; institutions may use this for strategic entry. Third, time horizons: short-term (days/weeks) involves breakout/breakdown triggers, while long-term (months) could see trend continuation if $10 is breached. Fourth, causal chain: repeated resistance tests weaken supply → higher lows show demand → compression builds energy → decisive move likely, but weak momentum delays it.
The internal mechanics of LINK's price action involve a clash between horizontal resistance and rising support. Price is stuck below $10 due to sell-side liquidity at that level, while buyers step in earlier on dips, creating higher lows. This forms an ascending channel within a horizontal range, leading to a coiling pattern. The mechanism works as: whale accumulation below resistance → thin sell-side liquidity → repeated tests erode supply → momentum builds gradually → breakout requires volume surge. Weak momentum, indicated by slow RSI shifts, suggests the move may take longer, as market participants await catalyst confirmation.
Chainlink's range-bound behavior mirrors broader crypto trends, where altcoins often consolidate during periods of market uncertainty. Compared to other assets:
This context highlights LINK's position as a mid-cap asset susceptible to both technical patterns and sector-wide sentiment.
The bullish narrative faces several risks that could invalidate the current analysis. Key uncertainties include:
Failure conditions include a loss of ascending channel support or external market shocks that override technical patterns.
Practical near-term implications focus on trader positioning and market structure. A breakout above $10 could target $11, $12, attracting retail FOMO and institutional interest. Conversely, a breakdown below $8.4 may lead to tests of lower supports, increasing selling pressure. Traders should watch volume spikes and macroeconomic cues, as LINK's DeFi ties make it sensitive to regulatory developments and broader crypto sentiment shifts.
Chainlink, a leading decentralized oracle network, has historically experienced volatile price swings tied to DeFi adoption and market cycles. The current range-bound phase follows a pattern seen in previous corrections, where compression periods often precede significant moves. This structural framing helps contextualize the accumulation behavior as part of longer-term trend development rather than isolated noise.
Cross-market reactions provide additional context for LINK's performance. For instance, Ethereum's ability to hold key levels amid a $1.6B SPAC merger collapse shows relative strength in smart contract platforms. Meanwhile, Bitcoin's halving cycle midpoint with muted gains signals maturing dynamics that may influence altcoin behavior. Regulatory clarity calls from industry leaders, such as Ripple's CEO, could impact DeFi tokens like LINK by shaping investor sentiment.
Chainlink's price remains in a critical compression phase below $10, with technical indicators pointing to a potential breakout but momentum lagging. The interplay between ascending support and horizontal resistance defines the current accumulation range, offering opportunities for strategic traders while posing risks for the unprepared. Market participants must monitor key levels and broader sentiment to navigate the impending decisive move.
Evidence & Sources
Primary source: https://coinpedia.org/price-analysis/chainlink-stuck-below-10-how-long-will-link-price-stay-range-bound
Updated at: Apr 15, 2026, 10:38 AM
Data window: Apr 15, 2026, 08:02 AM → Apr 15, 2026, 08:31 AM
Evidence stats: 9 metrics, 1 timeline points.
Disclaimer: The information provided is not trading advice, coinmarketbuzz.com holds no liability for any investments made based on the information provided on this page. We strongly recommend independent research and/or consultation with a qualified professional before making any investment decisions.
All published reports are reviewed by our editorial team for factual consistency, neutrality, and reader clarity.