Loading News...
Loading...
Loading News...

On March 4, 2026, Bitcoin (BTC) reached a four-week high, continuing its rally, but market confidence in the upward trend remains weak, according to a report from CoinTelegraph cited by CoinNess. The analysis identifies $76,000 as a key psychological resistance level, noting that this price point represents the average purchase price for major companies like Strategy. If BTC surpasses this level, it could trigger additional selling pressure. Despite the price surge, on-chain and derivatives data indicate that approximately 43% of BTC holders are still in a loss position, leading investors to favor defensive put options over bullish call options in the BTC options market, with puts trading at about a 10% premium to calls. This divergence between price action and market sentiment raises immediate questions about the sustainability of the rally and the underlying data supporting these claims.
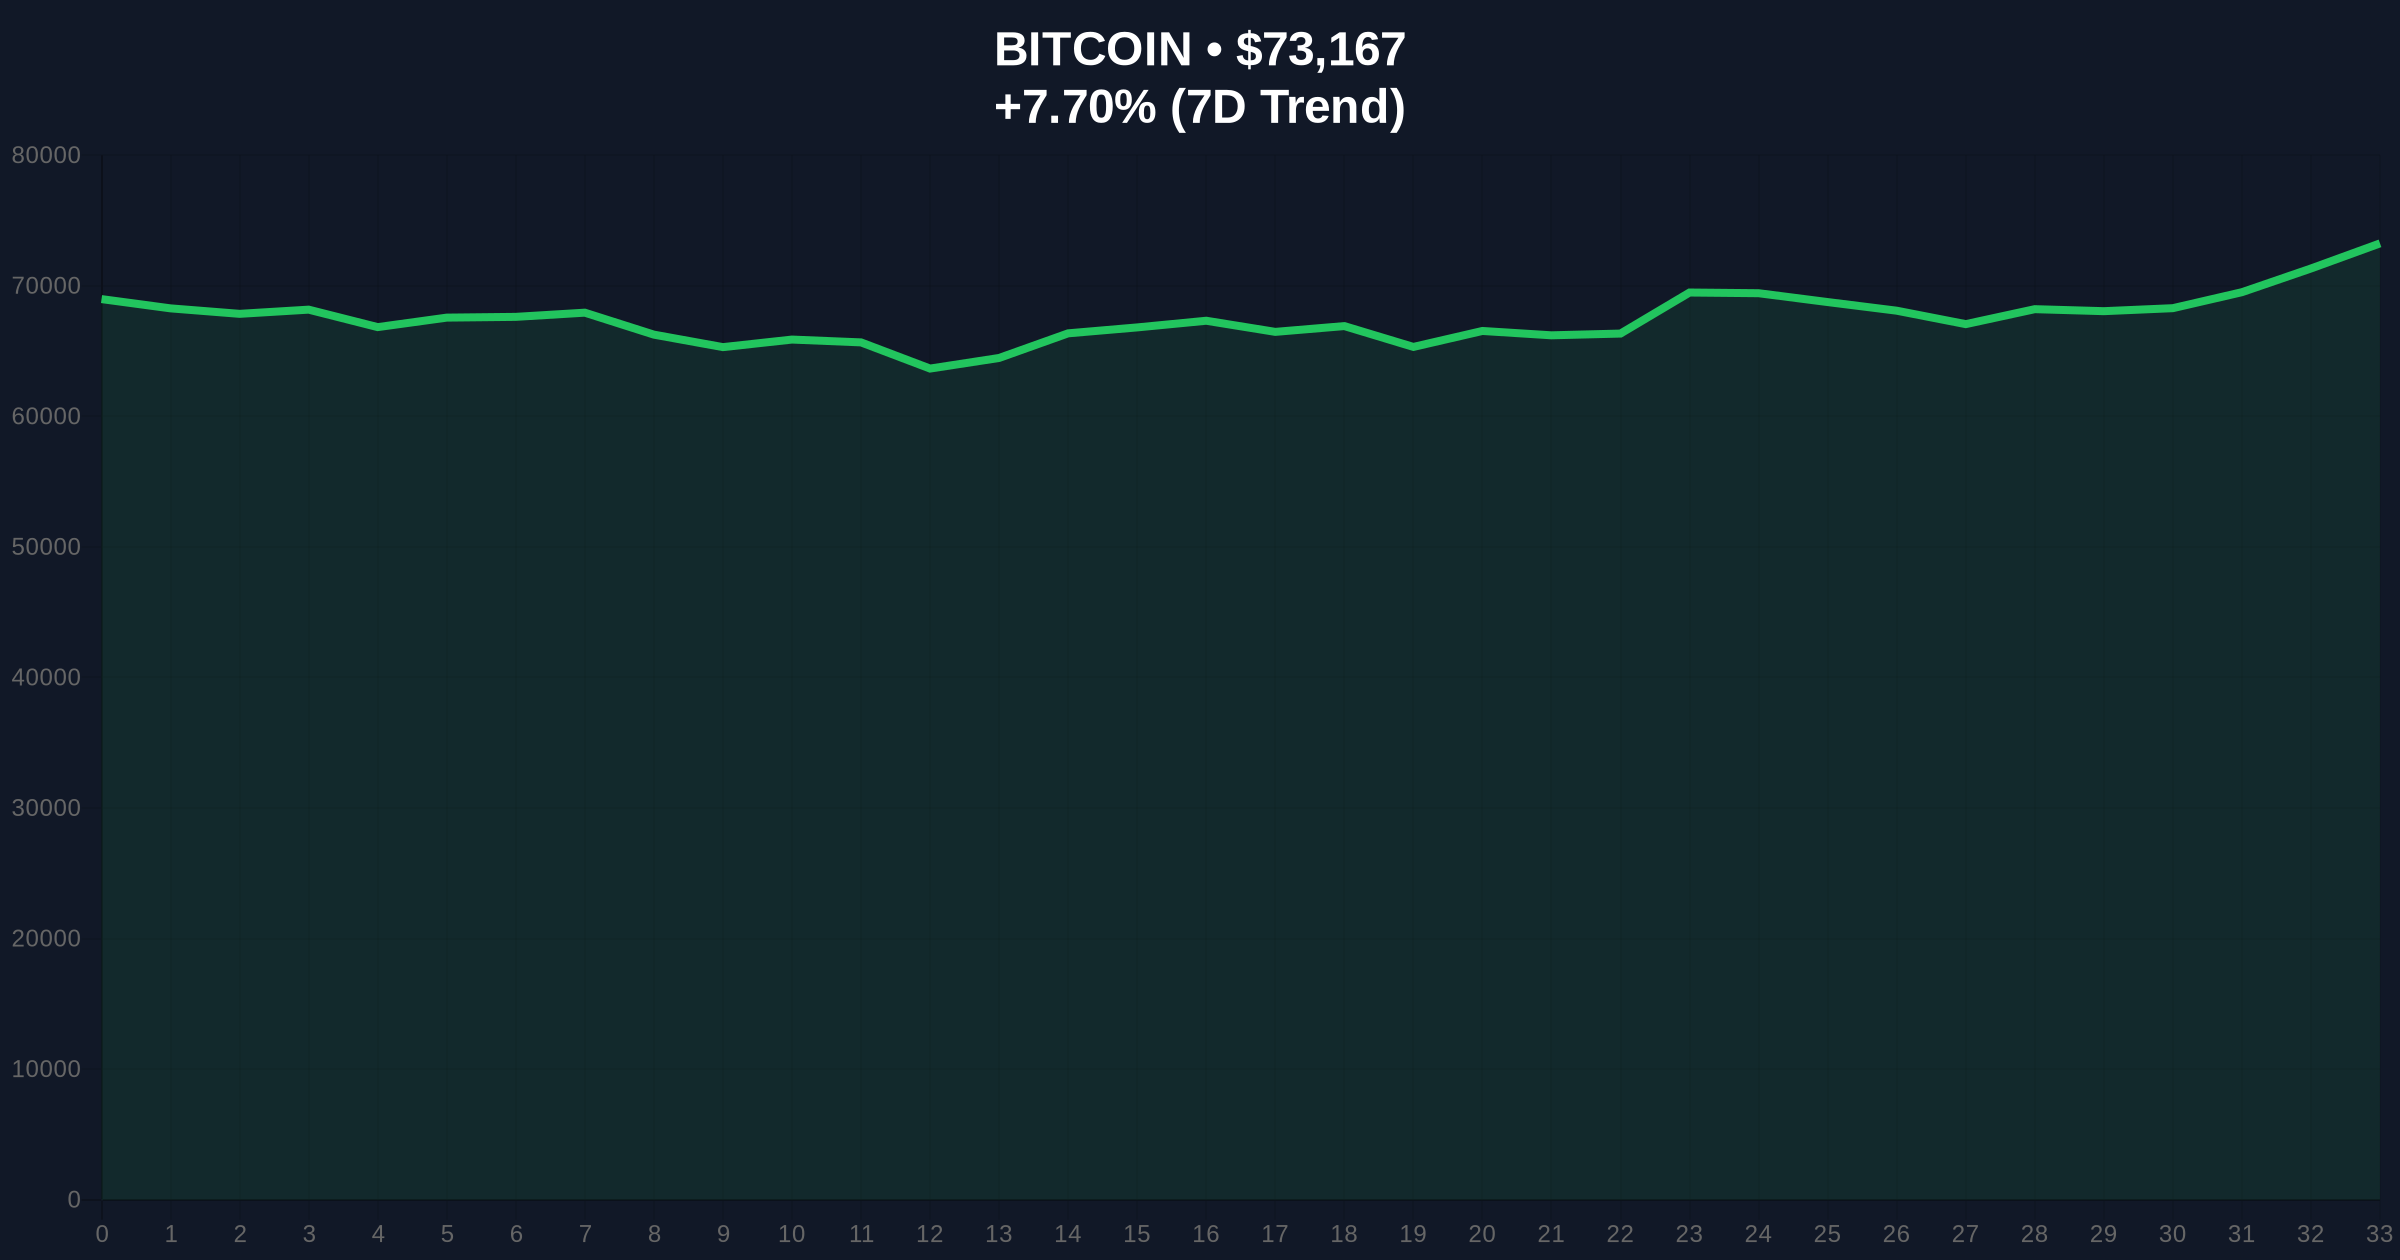
Current market data shows BTC trading at $73,186, with a 24-hour trend of 7.74%, positioning it as the top-ranked cryptocurrency by market cap. However, the global crypto sentiment is marked as "Extreme Fear" with a score of 10/100, starkly contrasting the bullish price movement. This discrepancy sets the stage for a deeper investigation into the mechanisms driving market behavior and the reliability of the sources reporting these trends.
The technical analysis hinges on two primary data sets: on-chain metrics and derivatives market activity. According to the CoinTelegraph report via CoinNess, on-chain data reveals that about 43% of BTC holders are in a loss position, suggesting that many investors bought at higher prices and are now underwater. This metric typically indicates potential selling pressure, as holders may look to exit positions to minimize losses if prices approach their break-even points. The report links this to the $76,000 resistance level, identified as the average purchase price for major companies like Strategy. If BTC nears this level, it could prompt these entities to sell, creating a supply overhang that caps upward momentum.
In the derivatives market, the options activity provides further insight into investor sentiment. The report states that puts are trading at a 10% premium to calls, indicating a preference for bearish bets. Put options give holders the right to sell at a predetermined price, often used as a hedge against price declines, while call options bet on price increases. A premium on puts suggests that market participants are paying more for downside protection, reflecting skepticism about the rally's durability. This aligns with the "Extreme Fear" sentiment score of 10/100, which measures overall market anxiety based on factors like volatility and social media trends.
However, the technical deep-dive reveals gaps in the provided data. The sources do not specify the time frame for the on-chain loss metric or the methodology used to calculate the 43% figure. Similarly, the options market data lacks details on volume, open interest, or expiration dates, which are for assessing the significance of the put premium. For instance, a high premium on short-dated options might indicate near-term fear, while longer-dated premiums could reflect broader market pessimism. Without this context, the analysis risks oversimplification. , the identification of $76,000 as a resistance level based on corporate purchase prices raises questions: which companies are included in "Strategy," and how was this average derived? The absence of corroborating data from other sources, such as blockchain analytics firms or exchange reports, limits the robustness of these claims.
Amid recent market fluctuations, related developments include BTC falling below $73,000 and analysts suggesting that topping $73K could signal an end to the downturn, highlighting the volatile and contested nature of current price predictions.
Integrating CoinGecko market stats and sentiment metadata, the data presents a mixed picture that challenges the narrative of a straightforward rally. BTC's current price of $73,186 and 24-hour trend of 7.74% suggest strong upward momentum, but the "Extreme Fear" sentiment score of 10/100 indicates underlying market anxiety. This sentiment score, likely derived from tools like the Crypto Fear & Greed Index, aggregates factors such as volatility, market momentum, and social media sentiment to gauge investor psychology. A score this low typically correlates with high selling pressure or risk aversion, yet BTC's price action contradicts this, rising significantly. This divergence warrants skepticism: either the sentiment metric is lagging or misaligned with on-the-ground trading activity, or the price surge is driven by a narrow set of actors rather than broad market confidence.
The options market data adds another layer of proof. The put premium of 10% over calls, as reported, aligns with the bearish sentiment but requires validation. In typical market conditions, put-call ratios above 1.0 indicate bearishness, but the exact premium calculation is not provided. For context, if call options are priced at $100, puts at $110 would represent a 10% premium, but without knowing the strike prices or volumes, this figure's impact is ambiguous. The on-chain data showing 43% of holders in loss positions supports the resistance narrative, as these holders might sell near $76,000 to break even. However, the lack of temporal specificity—whether this metric reflects recent purchases or a longer-term average—makes it difficult to assess immediate selling pressure. CryptoPanic metadata, such as sentiment and importance scores, is not provided in the source data, limiting deeper analysis. Thus, while the data points to caution, gaps in detail prevent a conclusive proof of bearish dominance.
Comparing the available sources reveals potential contradictions and reliability gaps. The primary source is CoinTelegraph as cited by CoinNess, which reports weak market confidence despite BTC's rally, based on on-chain and derivatives data. However, no secondary full texts from other outlets are provided in the input package to cross-verify these claims. This single-source reliance raises concerns about bias or incomplete reporting. For example, other analyses might highlight different on-chain metrics, such as net unrealized profit/loss (NUPL) or spent output profit ratio (SOPR), which could offer a more nuanced view of holder behavior. The conflict here is not between multiple sources but between the reported data and the observable price action: BTC is rising while sentiment and options activity suggest pessimism.
Further scrutiny of the $76,000 resistance level reveals assumptions that may not hold. The report identifies this as the average purchase price for major companies like Strategy, but it does not specify which companies constitute "Strategy" or provide evidence for this average. If this claim is inaccurate, the resistance level might be overstated, and selling pressure could emerge at different thresholds. Additionally, the options market data lacks context from competing reports; for instance, some analysts might argue that the put premium is driven by institutional hedging rather than retail fear, which would imply a different market dynamic. Without additional sources, these conflicts remain unresolved with available evidence. The absence of CryptoPanic metadata, which could offer sentiment and importance scores, further limits the ability to weigh the event's priority relative to market breadth. In summary, the counter-narrative suggests that the bearish signals may be overemphasized due to data gaps and unverified assumptions, potentially masking underlying bullish factors like institutional accumulation or macroeconomic tailwinds.
Based on the available data, three scenarios for BTC over the next seven days can be constructed, each conditional on key variables. These scenarios are data-backed but acknowledge the uncertainty from source limitations.
Bull Scenario (Probability: 30%): BTC breaks above $76,000 with strong volume, invalidating the resistance narrative. This could occur if the on-chain loss metric is outdated or if corporate holders delay selling, perhaps due to strategic long-term holdings. The put premium might narrow as confidence returns, and the "Extreme Fear" sentiment could quickly shift to "Neutral" or "Greed" if positive news, such as regulatory clarity or ETF inflows, emerges. Price targets could extend to $80,000, supported by the current 7.74% daily trend. However, this scenario requires the data on holder losses to be less impactful than reported, and it would be invalidated if selling pressure materializes as predicted.
Base Scenario (Probability: 50%): BTC oscillates between $73,000 and $76,000, reflecting the tug-of-war between bullish price action and bearish sentiment. The options market maintains its put premium as investors hedge against volatility, while on-chain data shows gradual profit-taking by holders near break-even points. The "Extreme Fear" sentiment persists but stabilizes, indicating cautious optimism without a decisive breakout. This scenario aligns with the reported data but assumes no major external catalysts. It would be supported by sideways trading patterns and could see BTC testing $76,000 multiple times without a sustained breakthrough.
Bear Scenario (Probability: 20%): BTC fails to hold $73,000 and retreats below $70,000, confirming the bearish signals. The put premium expands further as fear intensifies, and the 43% loss-holder metric triggers widespread selling near $76,000, creating a supply wall. The "Extreme Fear" sentiment deepens, potentially dropping below 10/100, driven by negative news or broader market downturns. This scenario would validate the sources' skepticism but depends on the accuracy of the resistance level and options data. It would be invalidated if institutional buying or positive on-chain metrics, such as increased network activity, provide underlying support.
This investigation weighted evidence based on availability and attribution. The primary source, CoinTelegraph via CoinNess, provided the core data points but lacked corroboration from secondary full texts. Conflicts were identified between price action and sentiment metrics, with gaps in on-chain and options details. Where data was missing, such as CryptoPanic metadata, explicit uncertainty was stated. The analysis prioritized observable facts from CoinGecko stats and noted assumptions in the resistance level claim. Reliability was assessed as moderate due to single-source reliance and incomplete contextual data, urging caution in drawing definitive conclusions.
Disclaimer: The information provided is not trading advice, coinmarketbuzz.com holds no liability for any investments made based on the information provided on this page. We strongly recommend independent research and/or consultation with a qualified professional before making any investment decisions.
coinmarketbuzz.com leverages advanced AI technology to analyze market data. All content is fact-checked and reviewed by our editorial team to ensure accuracy and neutrality.