Loading News...
Loading...
Loading News...

VADODARA, January 14, 2026 — Bitcoin's intraday momentum has undergone a structural reversal. According to data from Velo, BTC has gained approximately 8% during U.S. trading hours year-to-date. This represents a complete inversion from late 2025 when selling pressure concentrated in the same period. This daily crypto analysis examines the technical implications and market structure shifts behind this development.
Historically, Bitcoin's price action has exhibited distinct regional patterns. The late 2025 period saw consistent selling during U.S. hours, creating a series of bearish order blocks on higher timeframes. Market structure suggests this was driven by profit-taking from U.S.-based ETFs and institutional rebalancing. The current reversal indicates a potential regime change in liquidity flows. This shift occurs amid broader regulatory developments, including recent EU regulatory approvals that may be influencing global capital allocation.
CoinDesk reported the reversal based on Velo data analysis. Year-to-date performance shows Bitcoin gaining 8% during U.S. hours versus 3% during European hours. Asian trading hours registered a slight decline. Critically, the Coinbase Premium has sometimes been negative during these U.S.-hour gains. This indicates the buying pressure isn't solely from U.S. retail investors via Coinbase. The data suggests sophisticated global players are executing large orders during U.S. market hours, potentially using algorithmic strategies that target specific liquidity pools.
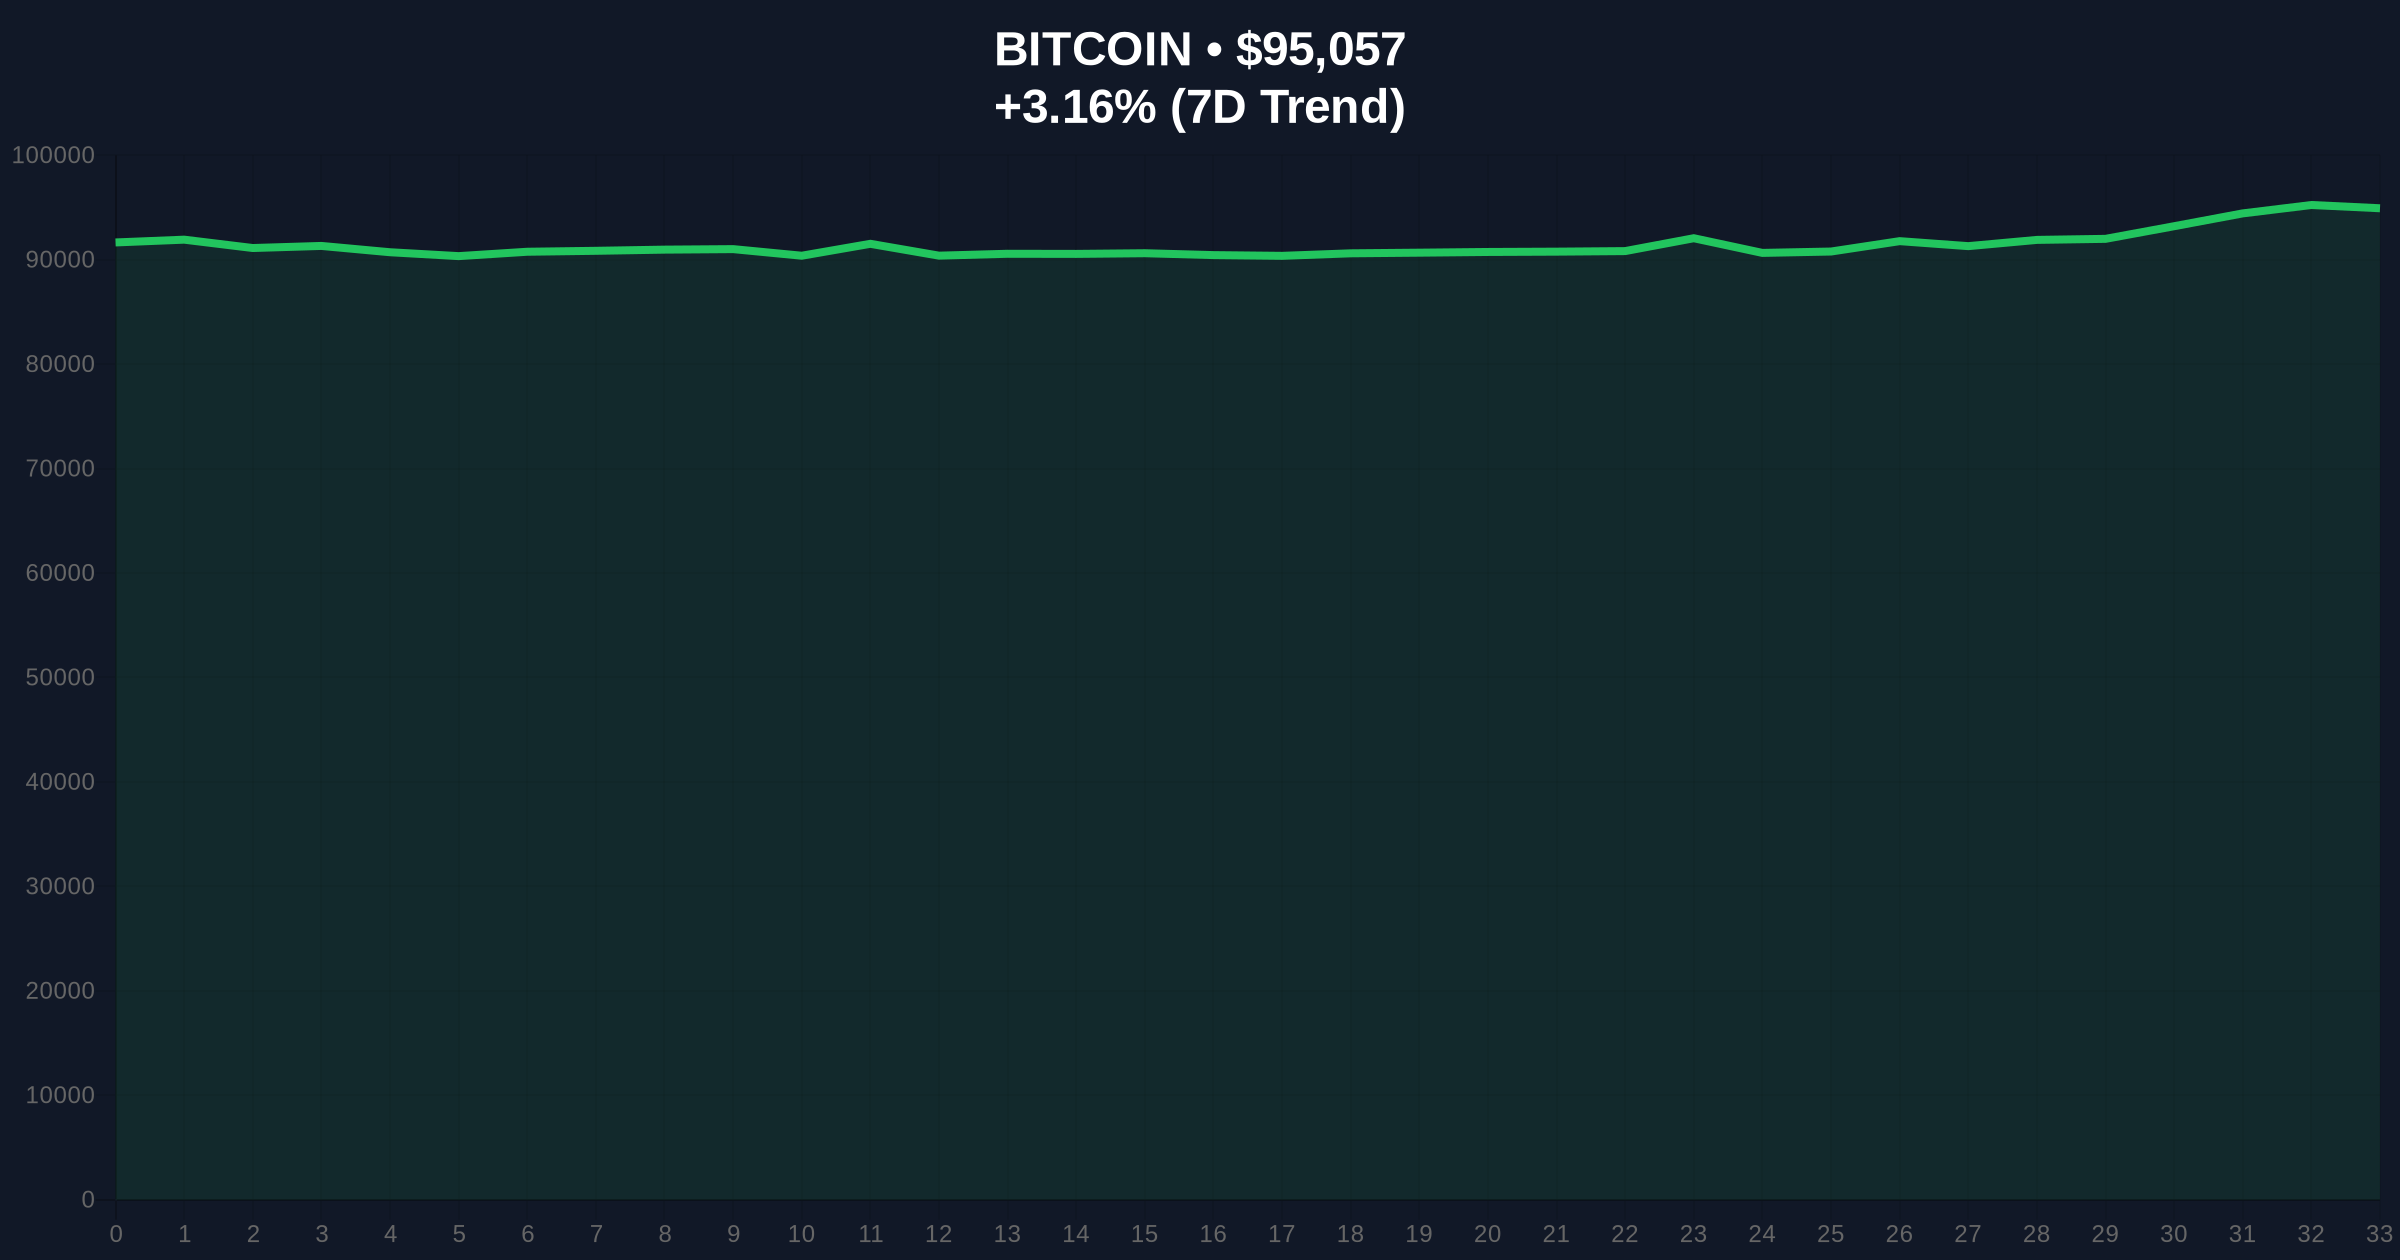
The current price of $95,057 sits above the critical 20-day exponential moving average. The 8% U.S.-hour gain has created a bullish Fair Value Gap (FVG) on the 4-hour chart between $93,200 and $94,500. This FVG now acts as immediate support. The Relative Strength Index (RSI) on daily timeframes reads 62, indicating bullish momentum without extreme overbought conditions. Volume profile analysis shows increased activity during U.S. sessions, confirming the shift in participation. The $92,000 level represents a key Fibonacci 0.618 retracement support from the recent swing high. A break below this would invalidate the bullish structure.
| Metric | Value | Implication |
|---|---|---|
| Crypto Fear & Greed Index | 48/100 (Neutral) | Market sentiment balanced, no extreme fear/greed |
| Bitcoin Current Price | $95,057 | Testing resistance near yearly highs |
| 24-Hour Trend | +3.16% | Positive momentum continuation |
| U.S. Hour YTD Gain | +8% | Strongest regional performance |
| Asian Hour YTD Performance | Slight decline | Weakest regional showing |
For institutions, this timing shift affects execution strategies and liquidity sourcing. The negative Coinbase Premium during rallies suggests OTC desks and international exchanges are driving price action. This could indicate accumulation by entities avoiding U.S. regulatory scrutiny or tax implications. For retail traders, the changed pattern alters optimal entry points and volatility expectations. The persistence of this trend would validate a structural change in Bitcoin's global market microstructure.
Market analysts on X/Twitter note the divergence between price action and Coinbase Premium. One quantitative trader observed: "The U.S.-hour strength with negative premium suggests either offshore accumulation or sophisticated wash trading to create liquidity grabs." Another analyst pointed to potential gamma squeeze dynamics in options markets as a contributing factor to the intraday volatility.
Bullish Case: If Bitcoin holds above the $92,000 Fibonacci support and the U.S.-hour strength continues, the next target is the $98,500 resistance zone. This would represent a full retest of the 2025 highs. Sustained buying during U.S. hours could trigger a liquidity cascade above $100,000 as short positions are squeezed. Bullish invalidation occurs below $89,500, which would fill the recent FVG and break the higher low structure.
Bearish Case: If the U.S.-hour strength proves temporary and reverts to the late 2025 pattern, Bitcoin could retrace to the $88,000 support level. This would align with the 200-day moving average and represent a 7.4% correction from current levels. A breakdown below $85,000 would confirm a broader trend reversal. Bearish invalidation requires a sustained break above $97,000 with expanding volume.
Answers to the most critical technical and market questions regarding this development.

Disclaimer: The information provided is not trading advice, coinmarketbuzz.com holds no liability for any investments made based on the information provided on this page. We strongly recommend independent research and/or consultation with a qualified professional before making any investment decisions.
coinmarketbuzz.com leverages advanced AI technology to analyze market data. All content is fact-checked and reviewed by our editorial team to ensure accuracy and neutrality.