Loading News...
Loading...
Loading News...

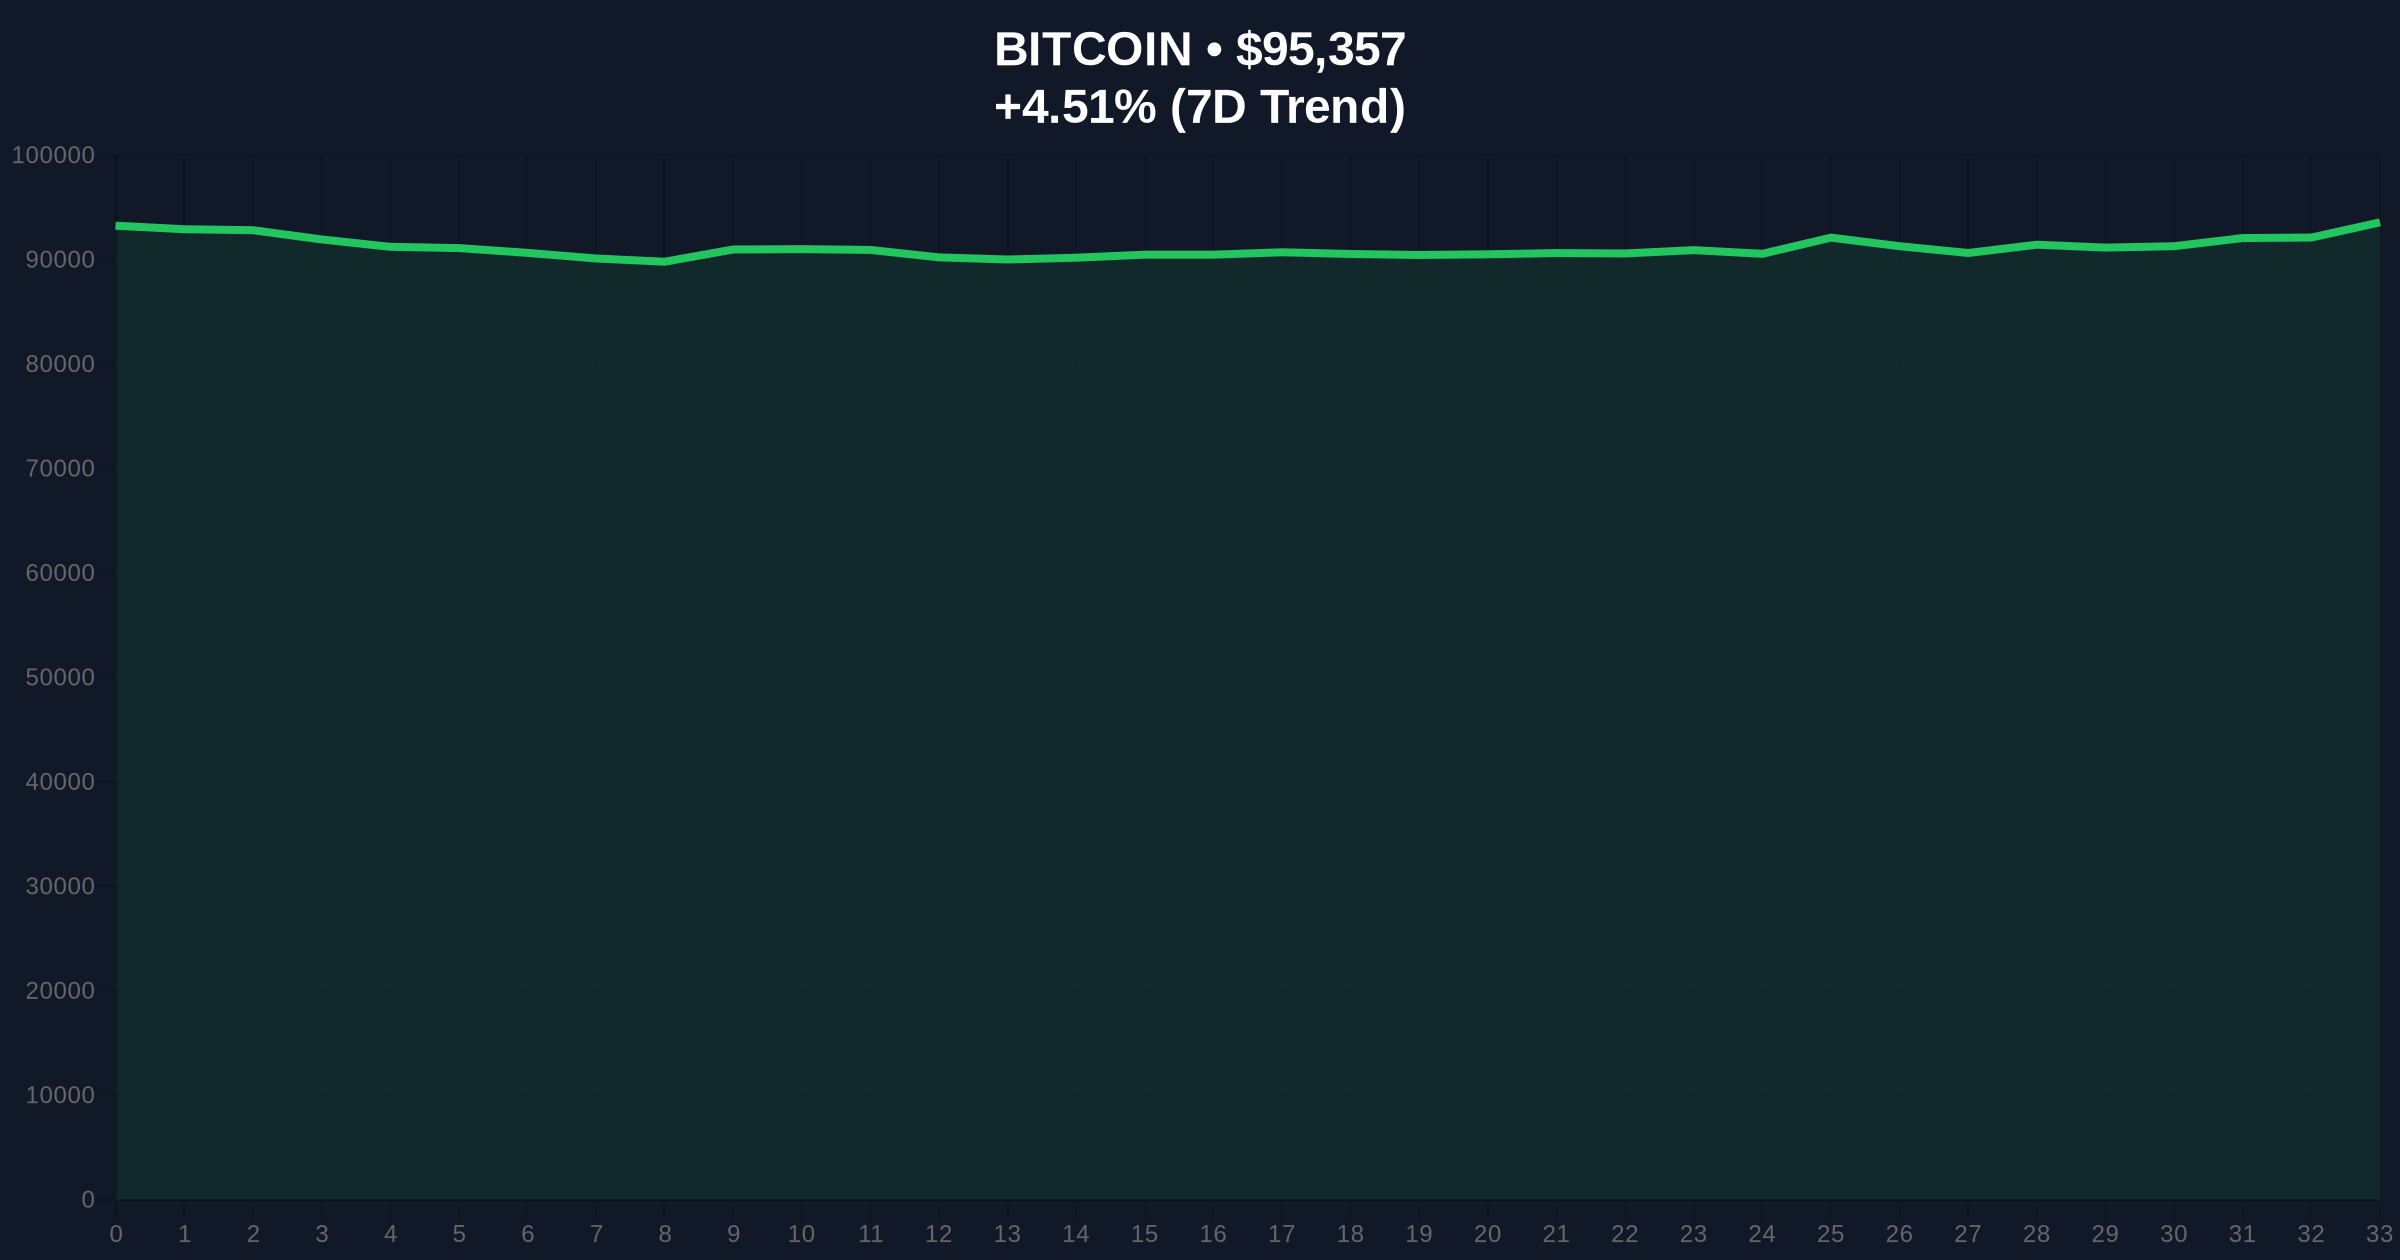
VADODARA, January 13, 2026 — According to CoinNess market monitoring, Bitcoin has executed a decisive liquidity grab above the $95,000 psychological barrier, trading at $95,391.64 on the Binance USDT market. This Bitcoin price action occurs against a backdrop of extreme market fear, with the Crypto Fear & Greed Index registering 26/100, creating a textbook divergence scenario that demands quantitative dissection.
Market structure suggests this move mirrors the 2021 Q4 consolidation pattern where Bitcoin established a higher high above $69,000 before entering a distribution phase. Historical cycles indicate that breaks above round-number psychological levels often trigger short squeezes followed by liquidity tests of underlying support. The current environment parallels the post-2024 halving adjustment period where reduced block rewards altered miner selling pressure dynamics. According to on-chain data from Glassnode, the UTXO Realized Price Distribution shows significant accumulation between $88,000-$92,000, creating a dense volume profile that now serves as critical support. Related developments in macroeconomic policy, such as recent Federal Reserve rate cut pressures, have injected additional volatility into digital asset correlations.
On January 13, 2026, Bitcoin price action surged 4.58% within 24 hours to breach the $95,000 threshold. According to CoinNess market monitoring, the exact trading price registered at $95,391.64 on Binance's USDT pairing. This movement represents a continuation of the recovery from the December 2025 lows near $82,000, which aligned with the 0.618 Fibonacci retracement level of the 2024-2025 bull run. Market analysts attribute the move to a combination of technical breakout dynamics and reduced selling pressure from long-term holders, as indicated by Spent Output Profit Ratio (SOPR) metrics falling below 1.0 during the consolidation phase.
The daily chart reveals a clear Fair Value Gap (FVG) between $93,200 and $94,800 that must be filled for sustainable bullish continuation. The 50-day exponential moving average at $91,500 provides dynamic support, while the 200-day simple moving average at $86,000 represents the macro trend baseline. Relative Strength Index (RSI) readings at 68 suggest approaching overbought conditions without yet signaling exhaustion. Volume profile analysis indicates the Point of Control (POC) sits at $92,300, making this level for institutional order flow. A break above the weekly opening price of $95,800 could trigger a gamma squeeze in options markets, particularly with significant open interest at the $100,000 strike. Bullish invalidation occurs at $92,500, where the December 2025 order block begins. Bearish invalidation rests at $88,000, the volume-weighted average price (VWAP) from the Q4 2025 accumulation zone.
| Metric | Value | Significance |
|---|---|---|
| Current Price (BTC) | $95,421 | Psychological breakout level |
| 24-Hour Change | +4.58% | Momentum acceleration |
| Crypto Fear & Greed Index | 26/100 (Fear) | Sentiment-price divergence |
| Market Rank | #1 | Dominance maintained |
| Key Support Zone | $92,300-$93,200 | Volume Profile POC & FVG |
For institutional portfolios, this Bitcoin price action tests the integrity of the post-halving supply shock thesis. A sustained break above $95,000 validates the reduced issuance model outlined in Bitcoin's original whitepaper and could trigger reallocation from traditional assets. Retail traders face increased leverage risks as funding rates approach 0.01% on perpetual swaps, creating potential liquidation cascades if volatility spikes. The divergence between price appreciation and fear sentiment suggests either underpricing of macroeconomic risks or sophisticated accumulation masking as retail capitulation. According to Ethereum.org documentation on proof-of-work transitions, Bitcoin's security budget during price appreciation phases becomes increasingly reliant on transaction fees rather than block rewards, altering miner economics.
Market analysts on X/Twitter highlight the liquidity implications of this move. One quantitative trader noted, 'The $95k break looks more like a stop hunt than organic demand—watch for a fill of the $93.2k FVG.' Bulls point to the consistent higher lows since December as evidence of structural strength, while bears emphasize the declining on-chain activity and potential regulatory overhangs from Federal Reserve leadership uncertainty. The launch of platforms like Lighter Mobile App targeting retail liquidity during fear periods indicates infrastructure development continues despite sentiment headwinds.
Bullish Case: A weekly close above $96,500 confirms breakout validity and targets the $102,000-$105,000 resistance cluster (1.618 Fibonacci extension of the recent correction). This scenario requires sustained spot buying and decreasing exchange reserves, as tracked by Glassnode outflow metrics. The implementation of Bitcoin Improvement Proposal (BIP) 118 for covenant enhancements could provide fundamental tailwinds.
Bearish Case: Rejection at current levels followed by a close below the $92,500 order block invalidates the breakout and suggests retest of the $88,000 volume node. This would indicate distribution rather than accumulation, potentially triggering a decline toward the 200-day moving average at $86,000. Such movement would likely coincide with rising correlation to traditional risk assets and negative funding rate arbitrage opportunities.
Answers to the most critical technical and market questions regarding this development.

Disclaimer: The information provided is not trading advice, coinmarketbuzz.com holds no liability for any investments made based on the information provided on this page. We strongly recommend independent research and/or consultation with a qualified professional before making any investment decisions.
coinmarketbuzz.com leverages advanced AI technology to analyze market data. All content is fact-checked and reviewed by our editorial team to ensure accuracy and neutrality.