Loading News...
Loading...
Loading News...

VADODARA, January 13, 2026 — U.S. spot Bitcoin ETFs recorded a total net inflow of $116.89 million on January 12, according to data compiled by TraderT, marking a return to positive flows after five consecutive trading days of net outflows. This daily crypto analysis examines the structural implications of this liquidity shift, with Fidelity's FBTC leading inflows at $111.75 million, while BlackRock's IBIT saw an outflow of $70.44 million. Market structure suggests this move may represent a liquidity grab amid persistent fear sentiment, echoing patterns from the 2021 correction.
This inflow reversal occurs against a backdrop of heightened market fear, with the Crypto Fear & Greed Index at 26/100, indicating extreme caution. Similar to the 2021 correction, where ETF flows preceded a consolidation phase, the current five-day outflow streak had drained approximately $500 million in cumulative liquidity, creating a Fair Value Gap (FVG) that now appears to be filling. Historical cycles suggest such sequences often precede volatility compression, as seen in post-merge issuance adjustments for Ethereum. The broader regulatory environment, including recent developments like the Tennessee court stay in the CFTC vs state gambling law clash, adds complexity to institutional positioning.
On January 12, 2026, U.S. spot Bitcoin ETFs recorded a net inflow of $116.89 million, according to TraderT data. Fidelity's FBTC led with an inflow of $111.75 million, while Grayscale's GBTC and Mini BTC funds saw inflows of $64.25 million and $4.85 million, respectively. VanEck's HODL added $6.48 million. In contrast, BlackRock's IBIT experienced a net outflow of $70.44 million, indicating divergent strategies among major issuers. This data, sourced from primary ETF flow trackers, highlights a shift from the previous five-day outflow streak that had pressured Bitcoin's price action.
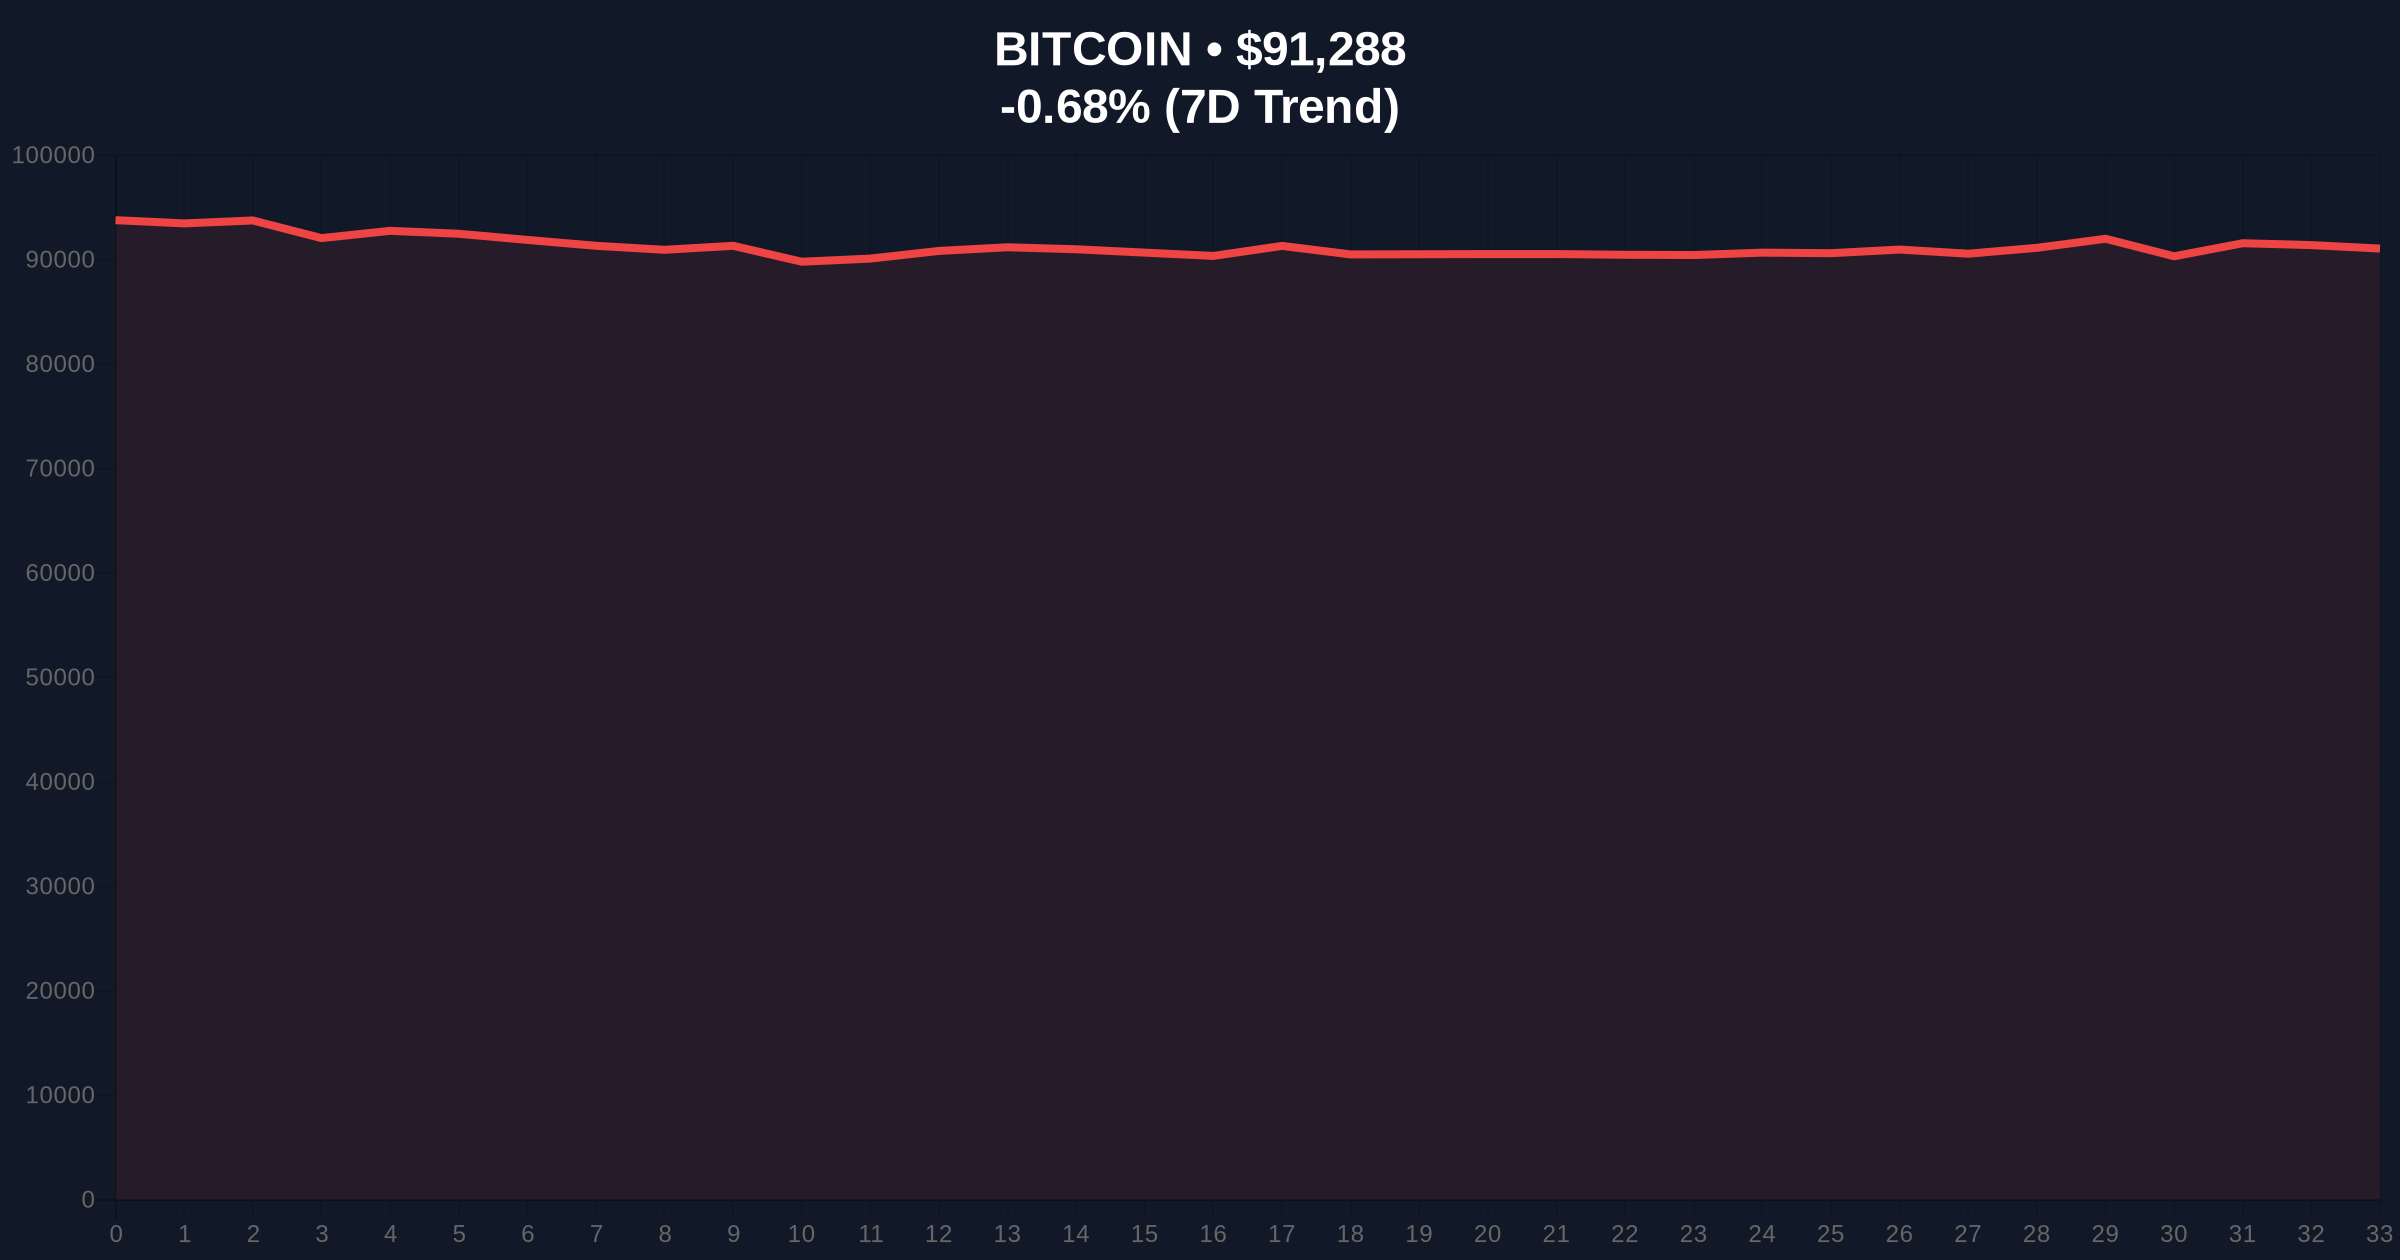
Bitcoin's current price sits at $91,319, down 0.65% over 24 hours, with key support identified at the $90,000 psychological level and the 50-day moving average near $88,500. The Relative Strength Index (RSI) hovers around 45, indicating neutral momentum with bearish bias. Volume profile analysis shows increased activity around the $92,000 resistance, suggesting an Order Block that may dictate short-term direction. Bullish Invalidation is set at $88,000, a break below which would invalidate the recent inflow optimism and target lower supports. Bearish Invalidation rests at $94,500, above which a Gamma Squeeze could accelerate gains. This technical setup mirrors the 2021 scenario where ETF inflows failed to immediately lift prices due to macro headwinds, as detailed in Federal Reserve historical policy documents.
| Metric | Value |
|---|---|
| Total ETF Net Inflow (Jan 12) | $116.89 million |
| Fidelity FBTC Inflow | $111.75 million |
| BlackRock IBIT Outflow | $70.44 million |
| Bitcoin Current Price | $91,319 |
| 24-Hour Price Change | -0.65% |
| Crypto Fear & Greed Index | 26/100 (Fear) |
This inflow reversal matters for both institutional and retail participants. Institutionally, it signals potential accumulation after a liquidity drain, akin to the 2021 cycle where similar flows preceded a rally. Retail impact is muted by fear sentiment, but on-chain data indicates increased UTXO age among long-term holders, suggesting hodling behavior. The divergence between Fidelity's inflow and BlackRock's outflow points to strategic repositioning, possibly in response to global regulatory shifts like Nigeria's crypto tax plan targeting anonymous transactions. Market structure suggests this could be a liquidity grab to fill the FVG created during the outflow streak.
Market analysts on X/Twitter highlight the inflow as a bullish signal amid fear, with some noting that "ETF flows often lead price action by 2-3 weeks." Others caution that the BlackRock outflow indicates institutional profit-taking, similar to patterns observed during the 2021 top. Sentiment remains divided, but the overall tone leans toward cautious optimism, with references to historical data from Ethereum.org on post-merge issuance effects.
Bullish Case: If inflows sustain and Bitcoin holds above $90,000, a retest of $95,000 resistance is likely, with potential for a breakout to $100,000 if fear sentiment improves. This scenario assumes continued institutional accumulation and positive macro cues.
Bearish Case: A failure to hold $88,000 support could trigger a drop to $85,000, exacerbated by renewed ETF outflows or negative regulatory news. This would align with the 2021 correction where inflows reversed abruptly.
Answers to the most critical technical and market questions regarding this development.

Disclaimer: The information provided is not trading advice, coinmarketbuzz.com holds no liability for any investments made based on the information provided on this page. We strongly recommend independent research and/or consultation with a qualified professional before making any investment decisions.
coinmarketbuzz.com leverages advanced AI technology to analyze market data. All content is fact-checked and reviewed by our editorial team to ensure accuracy and neutrality.