Loading News...
Loading...
Loading News...

VADODARA, January 3, 2026 — CoinMarketCap's Altcoin Season Index has registered at 23, according to data from the platform's official metrics, indicating a strong Bitcoin season as market sentiment plunges into fear territory. This daily crypto analysis examines the structural implications for portfolio allocation and price action across major cryptocurrencies.
Market structure suggests this reading mirrors historical Bitcoin dominance phases, similar to the Q4 2021 correction where the index hovered below 30 for 14 consecutive weeks. According to CoinMarketCap's methodology, the index compares the 90-day price performance of the top 100 cryptocurrencies by market capitalization, excluding stablecoins and wrapped coins, against Bitcoin. An altcoin season requires 75% of these assets to outperform Bitcoin, a threshold far from the current 23 score. Historical cycles indicate such low readings often precede extended periods of Bitcoin outperformance, driven by institutional capital flows into Bitcoin ETFs and macro uncertainty. Related developments include recent analysis on the Crypto Fear & Greed Index climbing to 29 and Bitcoin whale accumulation patterns, which align with this dominance trend.
On January 3, 2026, CoinMarketCap's Altcoin Season Index was recorded at 23, based on real-time data from their analytics dashboard. The index calculation involves tracking the percentage of top 100 cryptocurrencies that have outperformed Bitcoin over the past 90 days. A score closer to 100 signifies an altcoin season, while values below 25 typically indicate a Bitcoin season. This data point follows a period of heightened volatility, with Bitcoin testing key support levels amid broader market fear. According to the source material from Coinness, the index excludes stablecoins and wrapped coins to focus purely on speculative asset performance, providing a cleaner signal for market rotations.
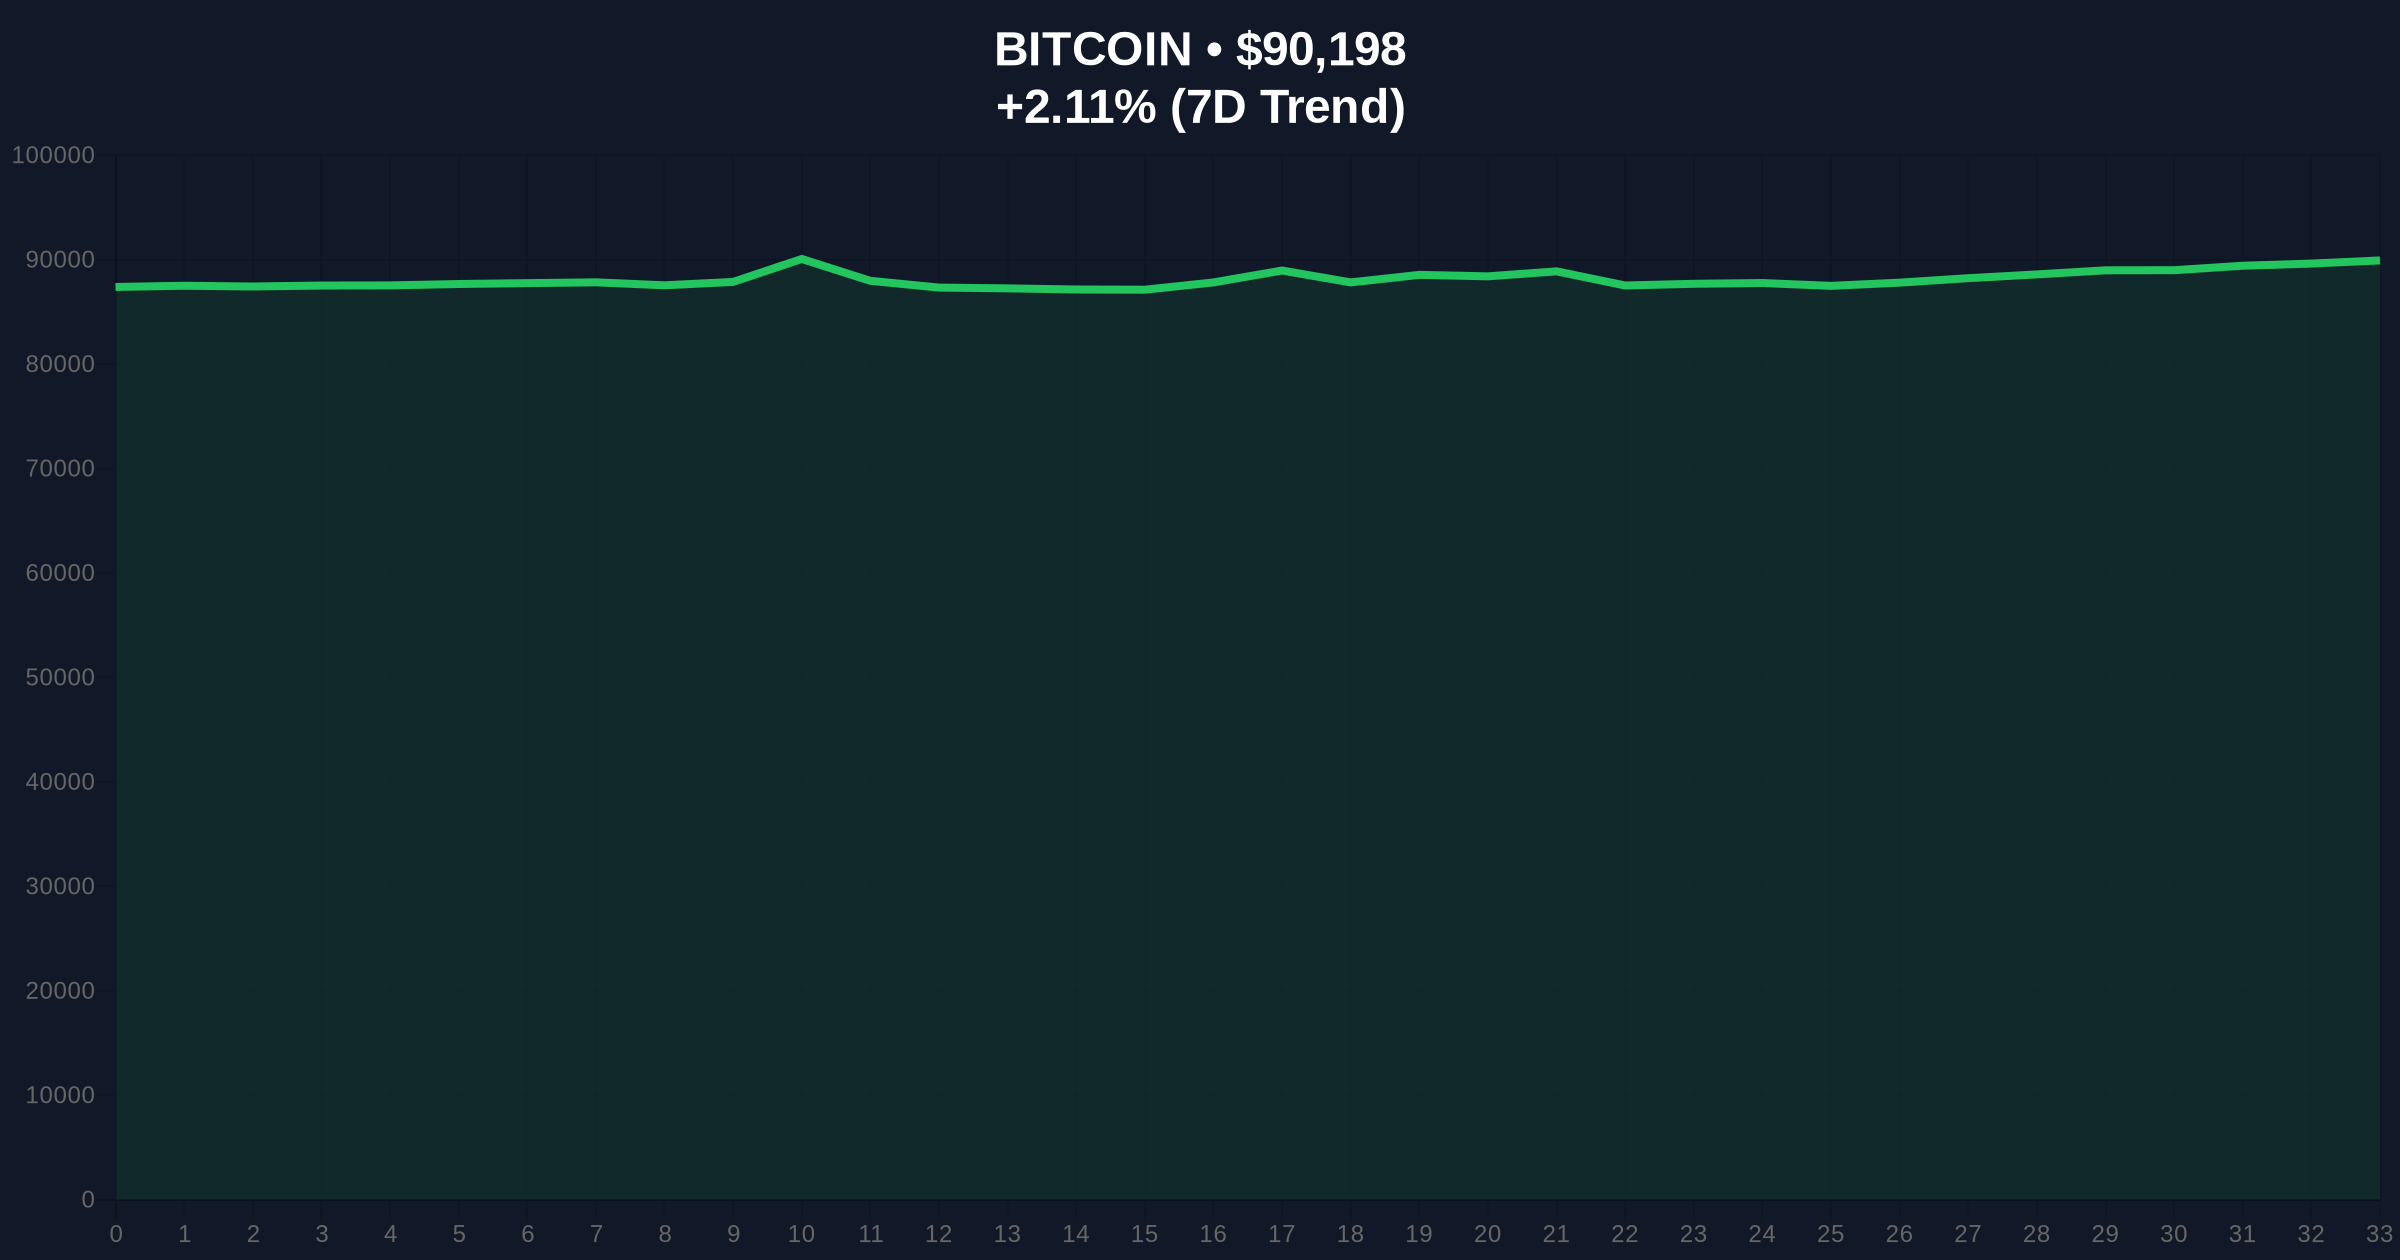
On-chain data indicates a Liquidity Grab below $90,000 as Bitcoin consolidates. The Relative Strength Index (RSI) on daily charts sits at 42, suggesting neutral momentum with bearish bias. A critical Fair Value Gap (FVG) exists between $88,500 and $91,200, which may act as a magnet for price action. The 50-day moving average at $93,500 serves as immediate resistance, while the 200-day moving average at $85,000 provides longer-term support. Volume Profile analysis shows high node concentration at $89,000, indicating a potential Order Block for institutional accumulation. Bullish Invalidation is set at $85,000 (break of 200-day MA), and Bearish Invalidation at $95,000 (clearance of 50-day MA and FVG). This technical setup resembles the 2021 structure where Bitcoin dominance suppressed altcoins until a breakout above key Fibonacci levels.
| Metric | Value | Implication |
|---|---|---|
| Altcoin Season Index | 23 | Strong Bitcoin season (threshold: 75 for altcoin season) |
| Crypto Fear & Greed Index | 29/100 (Fear) | Extreme fear sentiment, often a contrarian indicator |
| Bitcoin Price | $90,184 | Testing key support, down 2.10% in 24h |
| Bitcoin Dominance | 54.3% (estimated) | Above 50% indicates capital rotation to Bitcoin |
| Top 100 Altcoins Outperforming Bitcoin | ~23% | Well below the 75% threshold for altcoin season |
For institutional portfolios, this index reading mandates a shift toward Bitcoin-heavy allocations, as altcoin beta exposure carries elevated risk during dominance phases. Retail traders face amplified volatility in altcoins, with potential for further underperformance if Bitcoin breaks key supports. The structural impact extends to decentralized finance (DeFi) protocols, where Total Value Locked (TVL) often correlates with altcoin strength. Market analysts note that similar readings in 2021 preceded a 6-month period where Bitcoin gained 35% while the top 50 altcoins averaged -12% returns. Regulatory clarity from entities like the SEC.gov on digital asset classifications could exacerbate this trend by favoring Bitcoin's established status.
Industry observers on X/Twitter highlight the index as a confirmation of "risk-off" behavior. One quantitative analyst noted, "The Altcoin Season Index at 23 signals capital preservation modes—Bitcoin becomes the safe haven." Another commentator referenced the potential for bearish liquidity traps in altcoin markets. Bulls argue that historical mean reversion suggests an impending altcoin rally once Bitcoin stabilizes above $95,000, but current sentiment remains cautious amid macroeconomic headwinds like potential Fed rate hikes.
Bullish Case: If Bitcoin holds the $88,500 Fibonacci support and breaks above the $93,500 50-day MA, a Gamma Squeeze could propel it to $100,000. This would likely lift the Altcoin Season Index toward 50 as capital rotates into high-beta assets. Altcoins like Ethereum, benefiting from the upcoming Pectra upgrade (EIP-7702), could outperform in this scenario.
Bearish Case: A break below $85,000 invalidates the bullish structure, triggering a Liquidity Grab toward $80,000. The Altcoin Season Index could drop below 20, exacerbating altcoin underperformance. This scenario mirrors the 2022 bear market where Bitcoin dominance peaked at 68% amid systemic deleveraging.
Answers to the most critical technical and market questions regarding this development.

Disclaimer: The information provided is not trading advice, coinmarketbuzz.com holds no liability for any investments made based on the information provided on this page. We strongly recommend independent research and/or consultation with a qualified professional before making any investment decisions.
coinmarketbuzz.com leverages advanced AI technology to analyze market data. All content is fact-checked and reviewed by our editorial team to ensure accuracy and neutrality.