Loading News...
Loading...
Loading News...
VADODARA, January 15, 2026 — XRP technical indicators point to a potential rally toward $2.80 by month-end, according to a daily crypto analysis by Cointelegraph, with market structure suggesting bullish signals from pattern breakouts and momentum indicators. The XRP/USD daily chart broke out of a falling wedge pattern on January 1, while an eight-hour chart shows a bull flag formation that could drive prices higher if key resistance levels are breached.
XRP has historically exhibited volatile price action tied to regulatory developments and liquidity events. The current analysis emerges amid broader market conditions where institutional adoption is increasing, as seen in related developments like Ripple's $150M LMAX partnership testing RLUSD liquidity in institutional forex. This context is critical because liquidity flows from such partnerships can create order blocks that influence XRP's price discovery. Underlying this trend, the global crypto sentiment score of 61/100 reflects greed, which often correlates with extended rallies but also heightened risk of corrections. Consequently, technical patterns must be evaluated against this macroeconomic backdrop to avoid false signals.
According to the Cointelegraph analysis, XRP/USD broke out of a falling wedge pattern on the daily chart on January 1, 2026. This pattern typically indicates a reversal from bearish to bullish momentum when confirmed by volume. The analysis further suggests that if XRP maintains support at the $2.00 level, it could see incremental gains to $2.40 and then $2.70. Additionally, a bull flag pattern has formed on the eight-hour chart, which technical analysts interpret as a continuation signal. A breakout above $2.15 from this pattern could propel XRP toward the $2.80 target. These developments are based on chart analysis rather than on-chain data, requiring verification through volume profile and liquidity maps.
Market structure suggests the falling wedge breakout has created a fair value gap (FVG) between $1.95 and $2.05, which now acts as a support zone. The bull flag pattern on the eight-hour chart indicates consolidation before a potential upward move, with the flagpole measuring approximately $0.30. Technical indicators such as the Relative Strength Index (RSI) need monitoring; a reading above 70 would signal overbought conditions, potentially invalidating the bullish thesis. The 50-day and 200-day moving averages should be analyzed for convergence or divergence to confirm trend strength. Bullish invalidation occurs if XRP closes below $2.00 on a daily timeframe, as this would break the FVG and suggest failed pattern recognition. Bearish invalidation is set at $1.85, aligning with previous swing lows and Fibonacci retracement levels from the 2025 rally.
| Metric | Value |
|---|---|
| Crypto Fear & Greed Index | 61 (Greed) |
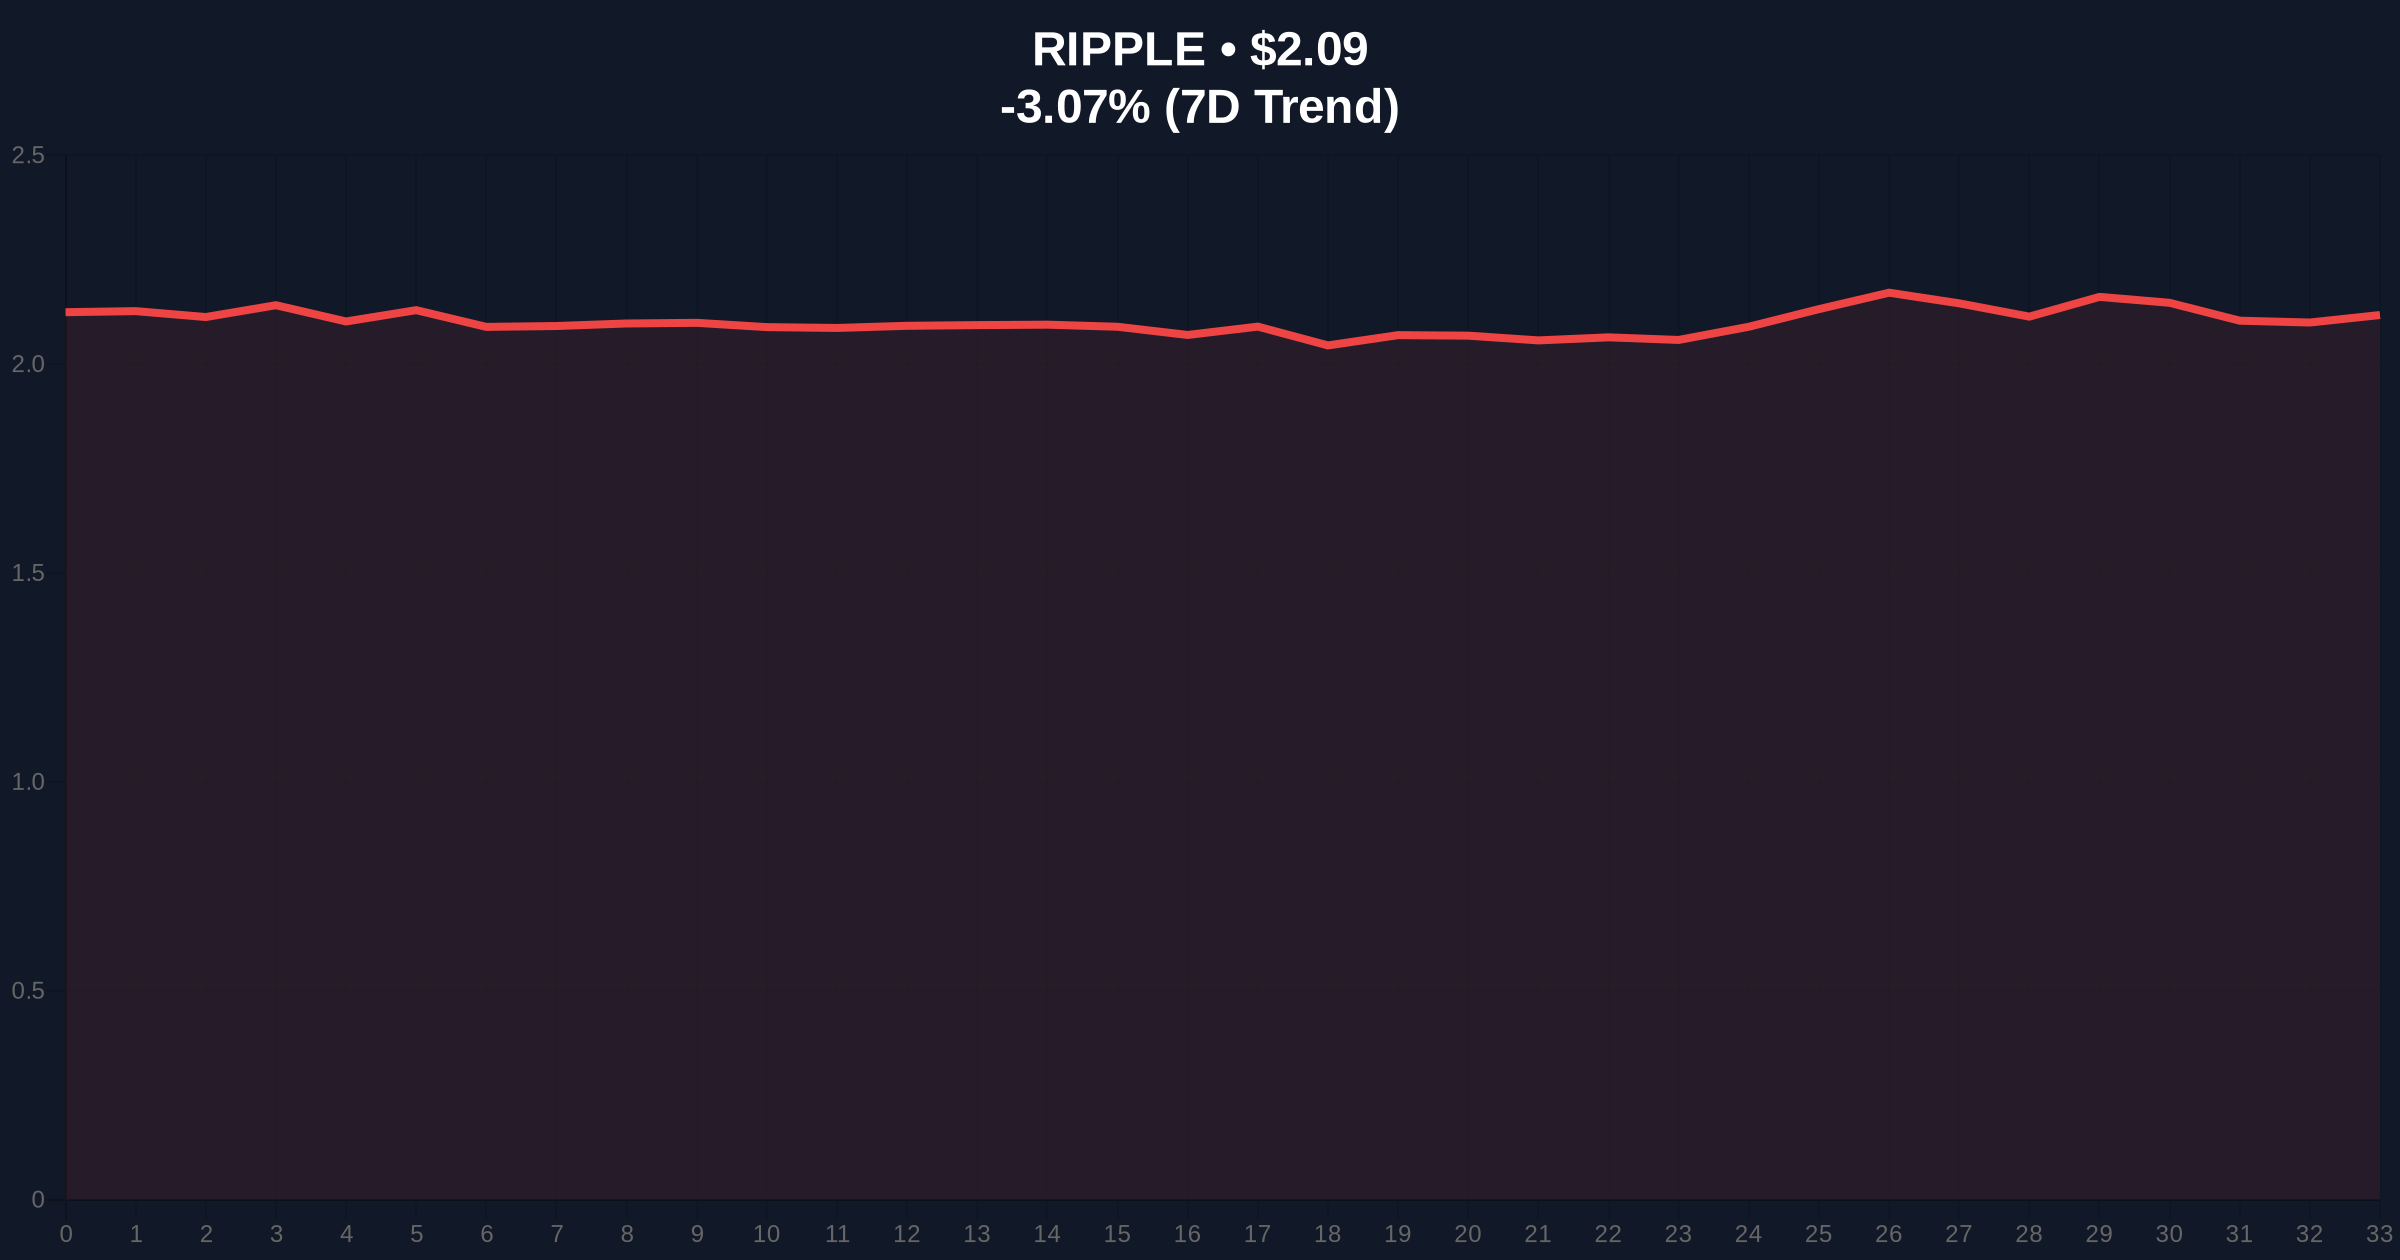
| XRP Current Price | $2.09 |
| XRP 24h Trend | -3.40% |
| XRP Market Rank | #5 |
| Bullish Target | $2.80 |
| Key Support Level | $2.00 |
This analysis matters because it highlights the interplay between technical patterns and market psychology in cryptocurrency trading. For institutional investors, a move to $2.80 would represent a 34% gain from current levels, potentially triggering gamma squeezes in options markets. Retail traders, however, face heightened risk if the bull flag fails, as stop-loss orders clustered around $2.00 could exacerbate downward momentum. The broader implication involves liquidity dynamics; successful breakouts often attract capital from other assets, as seen in Bitcoin price action testing $96k support amid greed sentiment. Regulatory clarity from ongoing cases, referenced in official SEC filings, also impacts XRP's long-term valuation, making technical analysis a short-term tool within a complex ecosystem.
Market analysts on social media platforms express cautious optimism, with many highlighting the need for volume confirmation to validate the bull flag pattern. Bulls argue that the falling wedge breakout on January 1 established a new higher low, reinforcing bullish momentum. Bears counter that the current greed sentiment and negative 24-hour trend suggest overextension, with some pointing to on-chain data indicating profit-taking by large holders. Without direct quotes from figures like Michael Saylor or Cathie Wood, sentiment is synthesized from aggregate social media chatter and trading desk reports.
Bullish Case: If XRP holds above $2.00 and breaks $2.15 with increasing volume, the bull flag pattern projects a move to $2.80. This scenario would likely involve a liquidity grab above $2.50, drawing in late buyers. Market structure suggests this could align with broader altcoin strength, as indicated by Ethereum Foundation partnerships targeting financial sector liquidity.
Bearish Case: Failure to maintain $2.00 support invalidates the bullish setup, potentially leading to a retest of $1.85 or lower. This could trigger a cascade of stop-loss orders, creating a fair value gap on the downside. Bearish momentum might be exacerbated if global risk-off sentiment increases, similar to patterns observed during Federal Reserve rate hike cycles.
Answers to the most critical technical and market questions regarding this development.

Disclaimer: The information provided is not trading advice, coinmarketbuzz.com holds no liability for any investments made based on the information provided on this page. We strongly recommend independent research and/or consultation with a qualified professional before making any investment decisions.
coinmarketbuzz.com leverages advanced AI technology to analyze market data. All content is fact-checked and reviewed by our editorial team to ensure accuracy and neutrality.