Loading News...
Loading...
Loading News...

VADODARA, February 7, 2026 — Daily crypto analysis reveals XRP investors have hemorrhaged approximately $1.2 billion over the past 18 months due to systematic emotional trading errors. According to on-chain data from Web3Alert, retail traders consistently bought near local tops between $2.00 and $3.50 and sold near bottoms around $1.20, creating a classic liquidity grab pattern. This behavior mirrors the 2017-2018 cycle where similar fear-driven capitulation led to prolonged bear markets.
Nick, founder of the on-chain tracking platform Web3Alert, identified the precise mechanics of the loss. According to CryptoBasic, retail investors actively accumulated XRP during the $2.00 to $3.50 rally phase. They then shifted to the sidelines after the price plummeted to the $1.20 level. This pattern represents a textbook example of buying high and selling low. Market structure suggests these actions were driven by emotion rather than fundamental analysis. The media outlet added that Ripple CEO Brad Garlinghouse has advocated for a contrarian strategy. He recommends finding opportunities during market fear and exercising caution during greed phases.
Historically, this pattern mirrors the 2021 altcoin cycle where retail traders suffered similar losses. In contrast, institutional players often accumulate during fear phases. Underlying this trend is a persistent Fair Value Gap (FVG) between retail sentiment and on-chain fundamentals. Similar to the 2017-2018 correction, current UTXO age bands show young coins moving to exchanges. This indicates panic selling. , the global crypto sentiment sits at "Extreme Fear" with a score of 6/100. This environment often precedes significant liquidity shifts.
Related developments in the market include Bitcoin breaking below key support levels amid similar fear sentiment and regulatory probes affecting exchange operations in South Korea.
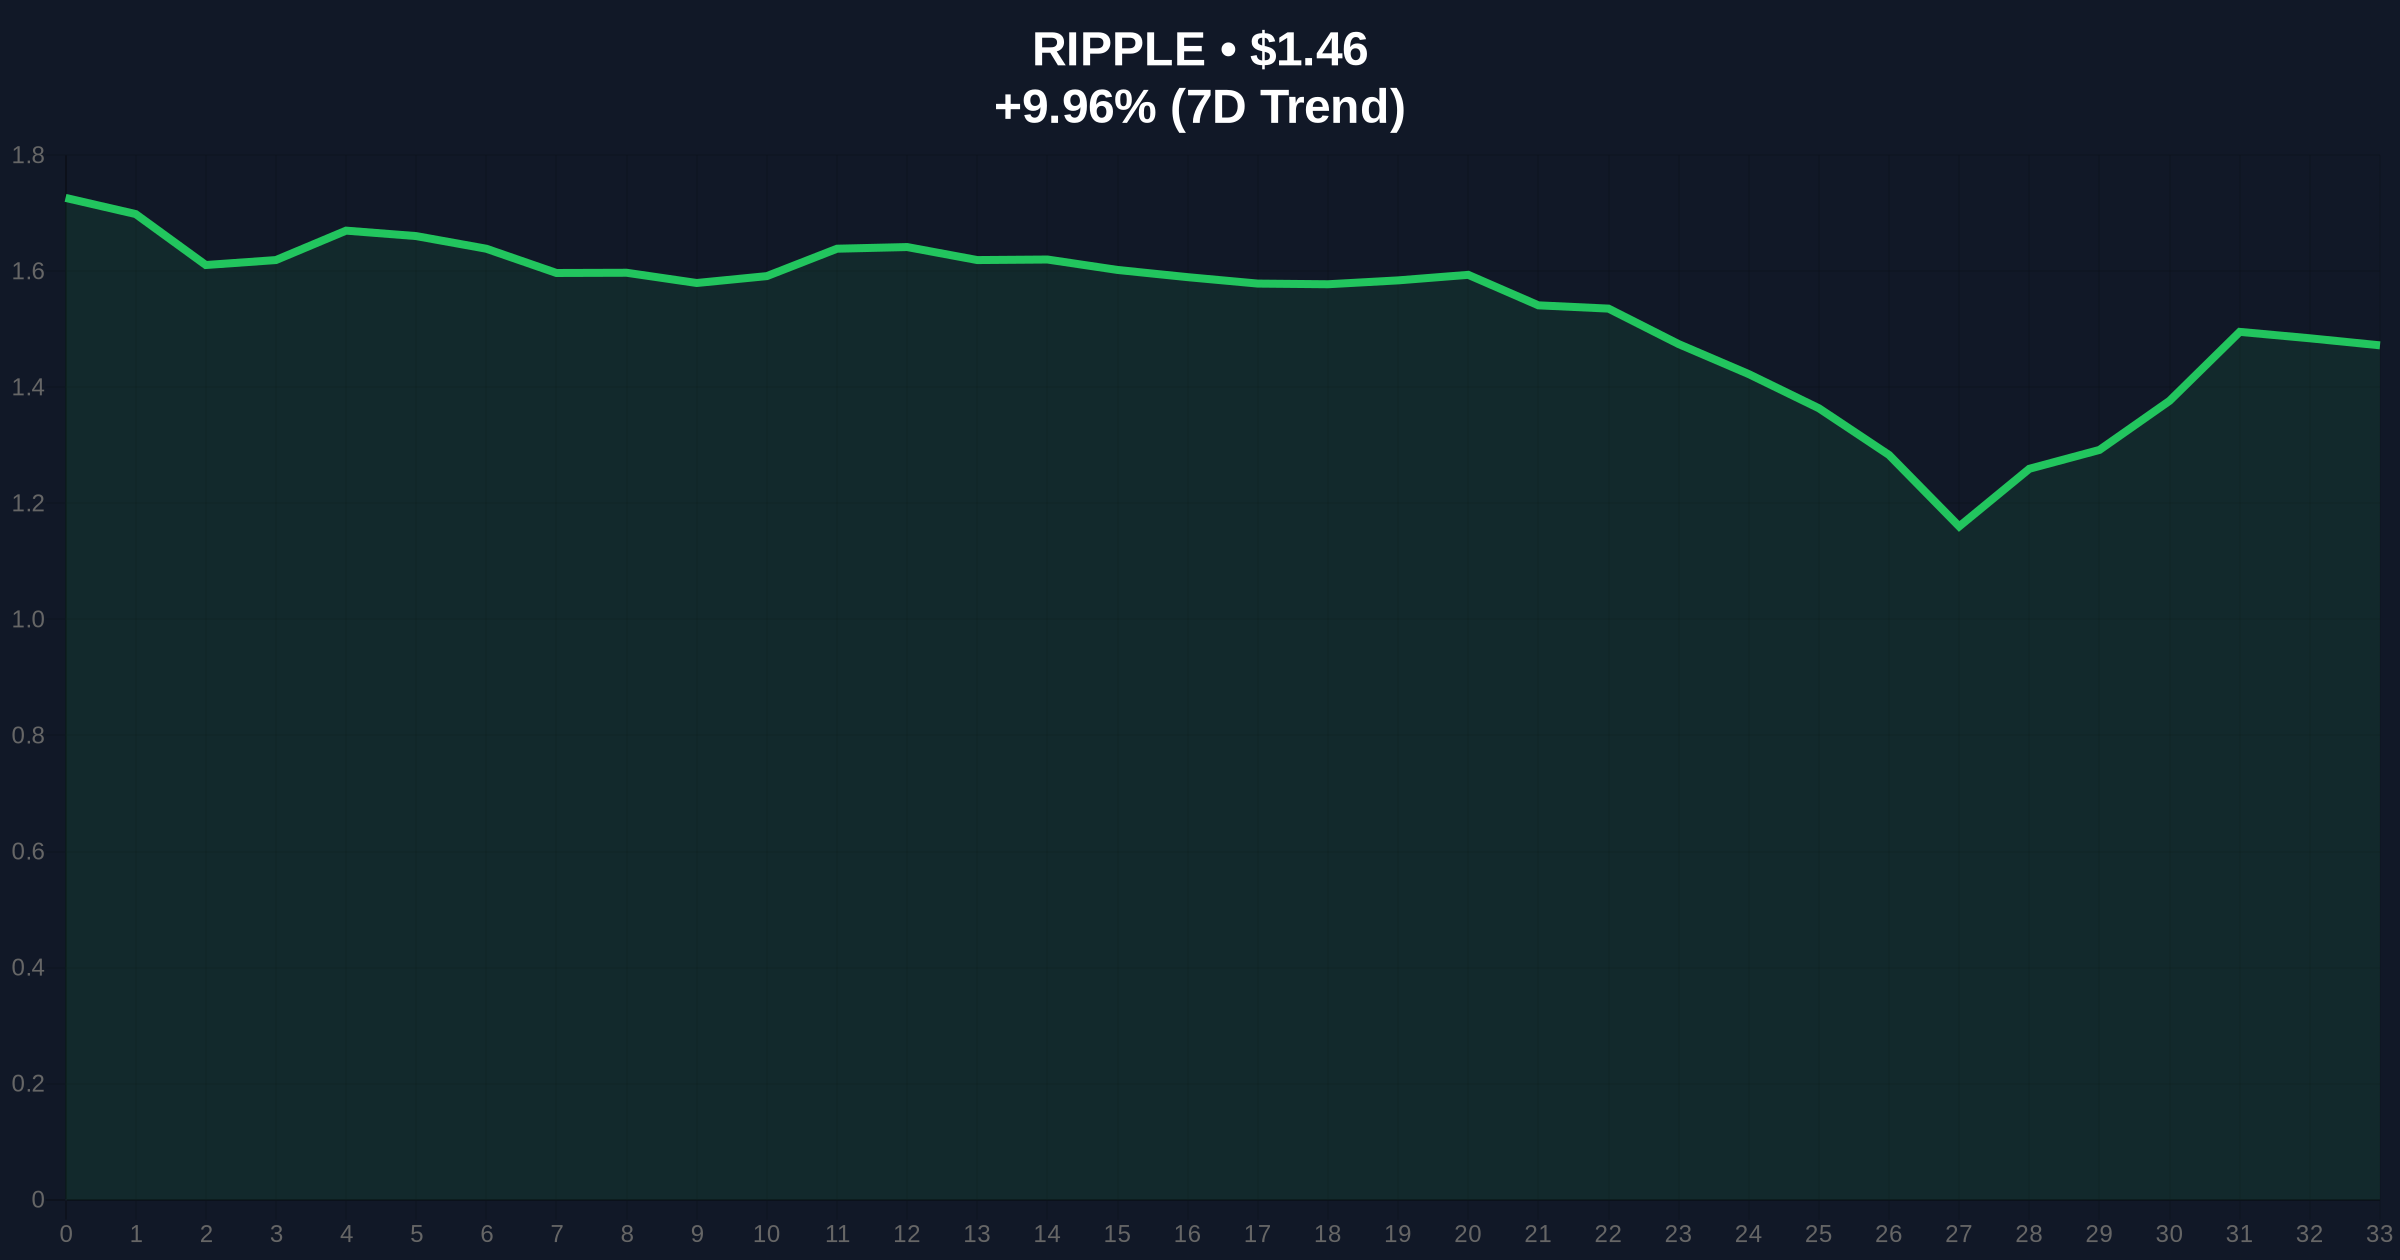
XRP currently trades at $1.46, down 10.28% in 24 hours. The price action reveals a clear Order Block between $1.20 and $1.30 where retail selling intensified. Technical analysis indicates a critical Fibonacci 0.618 retracement level at $1.28. This level must hold to prevent further downside. The Relative Strength Index (RSI) sits at 32, approaching oversold territory. However, volume profile analysis shows declining buy-side liquidity. This suggests weak conviction among remaining holders. The 200-day moving average at $1.52 acts as immediate resistance. A break above this level could signal a short-term reversal.
| Metric | Value | Source |
|---|---|---|
| XRP Current Price | $1.46 | CoinMarketCap |
| 24-Hour Price Change | -10.28% | Live Market Data |
| Market Rank | #5 | CoinMarketCap |
| Crypto Fear & Greed Index | 6/100 (Extreme Fear) | Alternative.me |
| Estimated Retail Losses (18mo) | $1.2B | Web3Alert On-Chain Data |
This pattern matters because it highlights a structural weakness in retail market participation. Institutional liquidity cycles typically exploit these emotional inefficiencies. According to on-chain data, smart money often accumulates during fear phases. Retail investors then provide exit liquidity during rallies. This dynamic creates persistent Fair Value Gaps (FVGs). , the SEC's ongoing regulatory stance, as detailed in official SEC filings, influences market sentiment. Legal precedents from the Ripple case continue to affect XRP's liquidity profile. The current extreme fear sentiment may present a contrarian opportunity. However, historical cycles suggest further pain before stabilization.
"The data clearly shows retail investors entering at cycle tops and exiting at cycle bottoms. This emotional trading pattern has cost them approximately $1.2 billion. Market fundamentals, including Ripple's ongoing partnerships and technological developments like the XRP Ledger's AMM feature, have not justified these extreme price swings. The current fear phase may represent a liquidity washout similar to Q4 2018." — CoinMarketBuzz Intelligence Desk
Market structure suggests two primary scenarios for XRP over the next quarter. The first scenario involves a hold above the $1.28 Fibonacci support. This could lead to a retest of the $1.52 resistance. The second scenario involves a break below $1.20. This would likely trigger further capitulation toward the $1.00 psychological level. On-chain data indicates weak hands have largely exited. However, residual selling pressure remains.
The 12-month institutional outlook remains cautious. Regulatory clarity from the SEC will be a key driver. Historical patterns from the 2021-2022 cycle suggest that assets with strong fundamentals often recover post-capitulation. However, the 5-year horizon depends on broader adoption of the XRP Ledger and Ripple's cross-border payment solutions.

Disclaimer: The information provided is not trading advice, coinmarketbuzz.com holds no liability for any investments made based on the information provided on this page. We strongly recommend independent research and/or consultation with a qualified professional before making any investment decisions.
coinmarketbuzz.com leverages advanced AI technology to analyze market data. All content is fact-checked and reviewed by our editorial team to ensure accuracy and neutrality.