Loading News...
Loading...
Loading News...

- XRP's daily Bollinger Bands analysis indicates sustained bearish momentum with price below the middle line at $2.0189
- Market structure suggests a $2 recovery this year is improbable without significant capital inflow
- Global crypto sentiment remains at "Extreme Fear" with a score of 20/100, suppressing speculative momentum
- Technical resistance has formed at the Bollinger Band middle line, creating a critical invalidation level
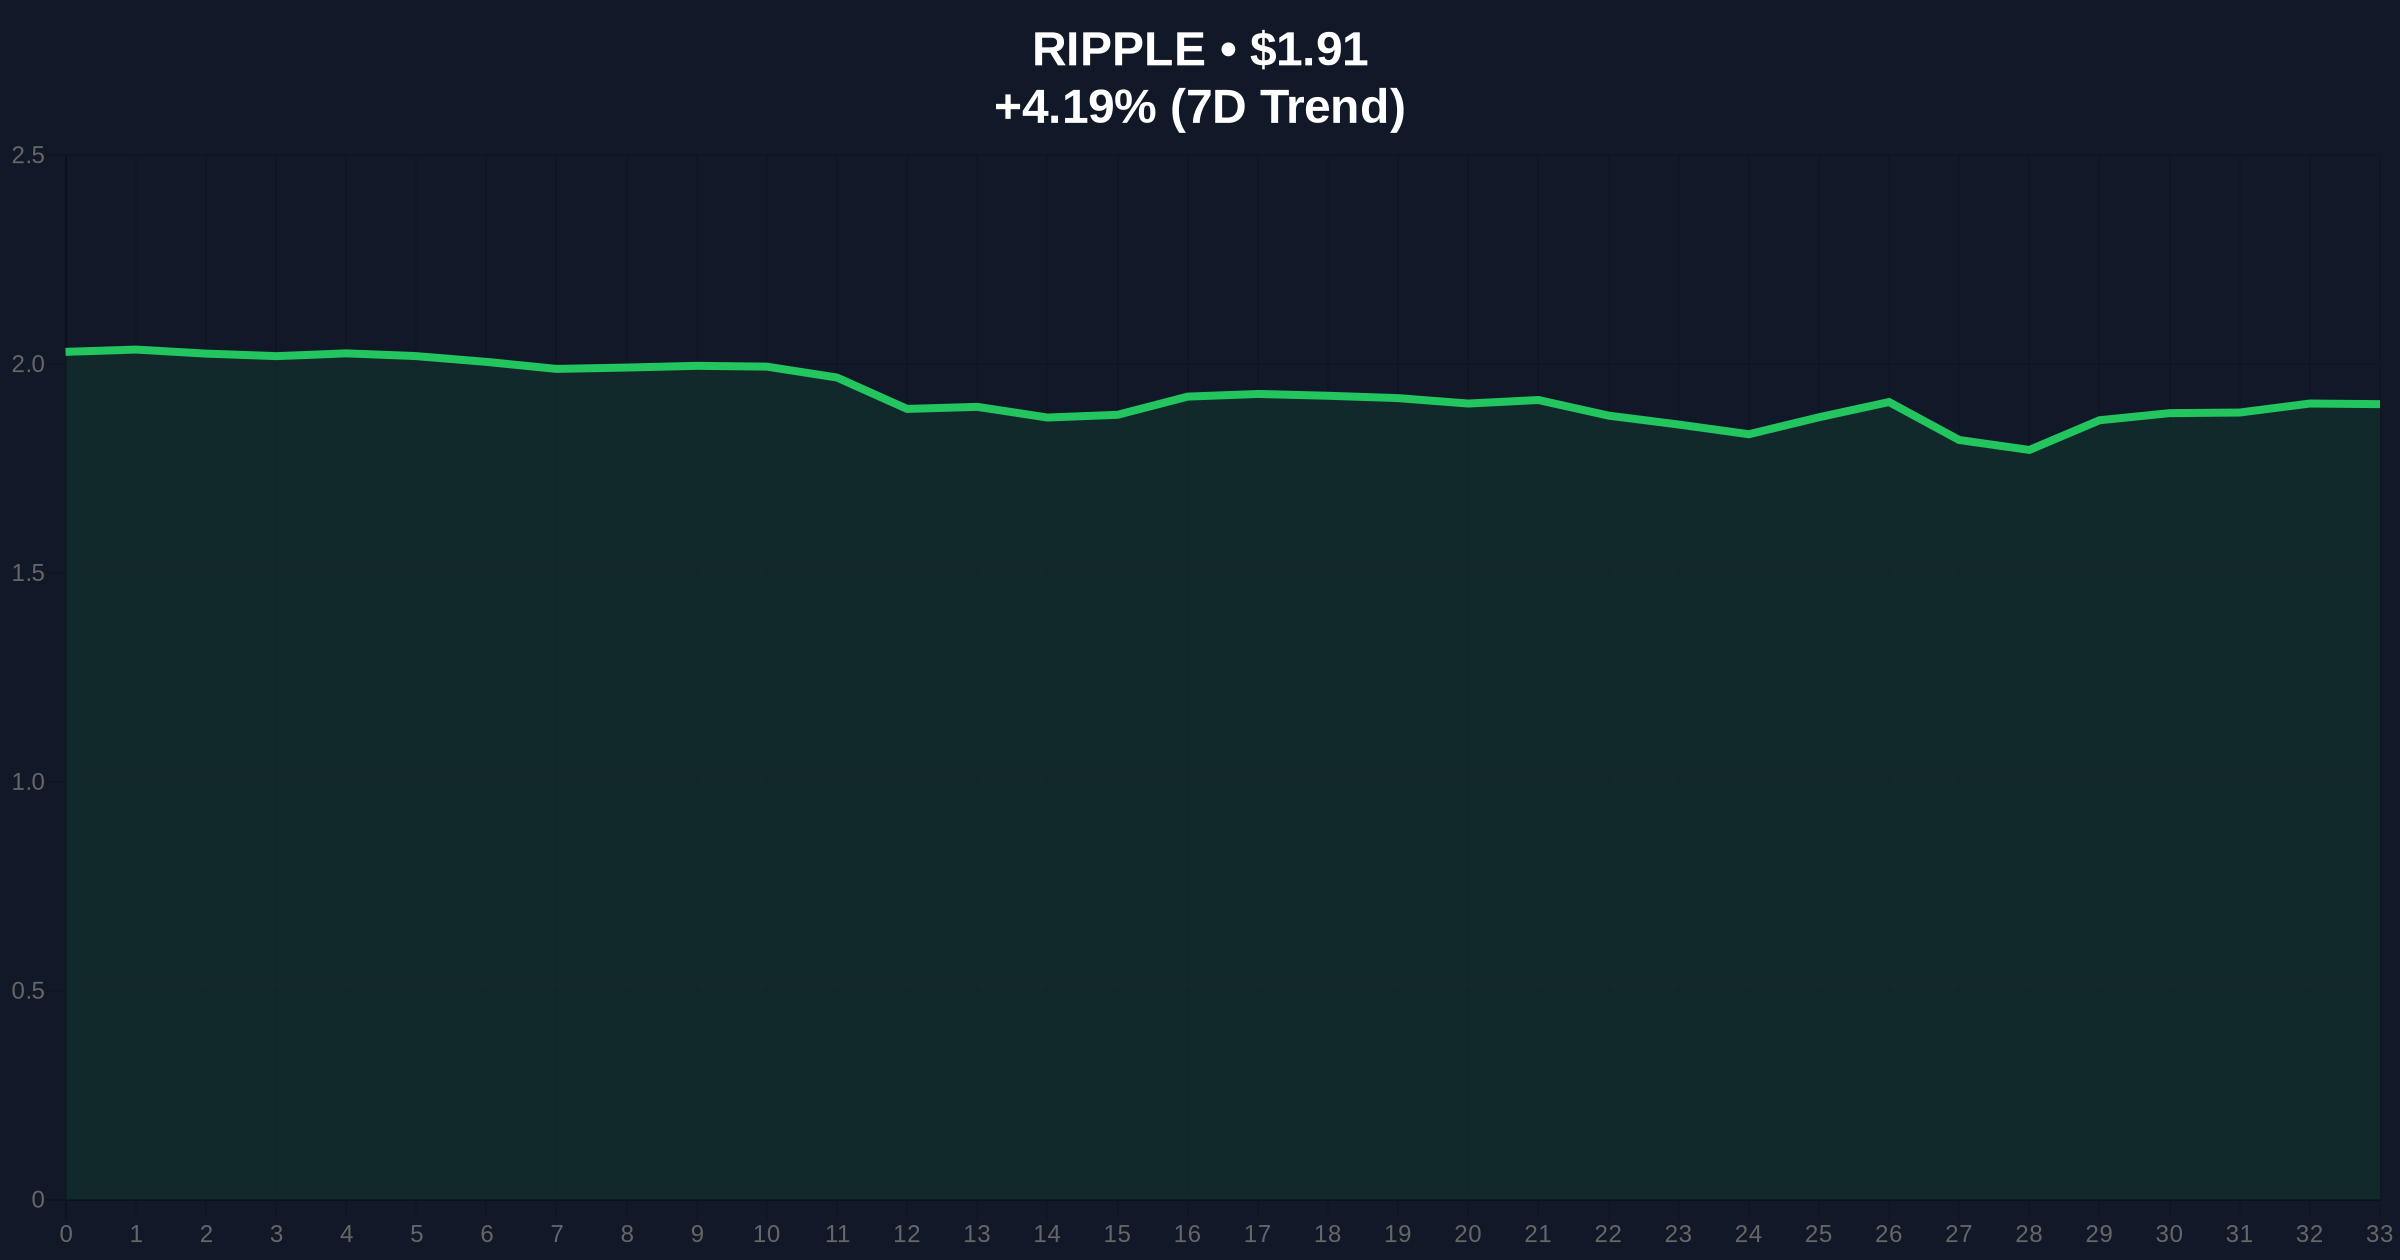
VADODARA, December 20, 2025 — Daily crypto analysis of XRP's technical structure reveals a bearish configuration that makes a recovery to the $2 psychological level unlikely before year-end, according to market data. The XRP/USDT daily chart shows the asset trading below the middle line of its Bollinger Bands at approximately $2.0189, indicating insufficient buying pressure for a sustained rally. Market structure suggests this technical resistance level has become a critical order block that must be reclaimed for any bullish reversal scenario.
This technical deterioration occurs against a backdrop of institutional uncertainty and regulatory headwinds that have plagued XRP since the SEC's 2020 lawsuit against Ripple. The asset's failure to reclaim its 2021 all-time high of $3.84 has created a persistent fair value gap (FVG) that continues to act as a gravitational pull on price action. Underlying this trend is the broader crypto market's struggle with liquidity fragmentation, particularly following the implementation of Ethereum's EIP-4844 proto-danksharding upgrade, which has redirected developer attention and capital away from alternative layer-1 protocols. Consequently, XRP faces structural challenges beyond mere technical indicators, with on-chain data indicating declining network activity and reduced large holder accumulation over the past quarter.
According to technical analysis published by U.Today, XRP's daily Bollinger Bands configuration shows the asset consistently trading below the middle line, which currently sits at approximately $2.0189. This positioning indicates a lack of the capital inflow necessary for significant upward momentum. The analysis concludes that while it is premature to confirm a complete downtrend, the probability of XRP reaching $2 before December 31 remains low based on current momentum indicators. For any bullish reversal to materialize, XRP must decisively reclaim and hold above the Bollinger Band middle line. Should the daily candle close below this level, it is expected to transform into strong technical resistance, potentially triggering further downside pressure.
Market structure suggests XRP is currently testing a critical volume profile node between $1.85 and $1.95, where previous consolidation occurred throughout Q3 2025. The Bollinger Band squeeze observed in early December failed to resolve upward, indicating bearish continuation rather than reversal. The 50-day moving average at $2.12 now acts as dynamic resistance, while Fibonacci support at $1.78 (the 0.618 retracement from the November high) represents the next significant downside target. RSI readings remain below 45 on daily timeframes, confirming bearish momentum without reaching oversold conditions that might trigger a relief rally. The Bollinger Band width contraction suggests decreased volatility, which typically precedes directional moves—in this case, the failure to break upward increases probability of downward resolution.
| Metric | Value |
|---|---|
| Current Price | $1.91 |
| 24h Trend | 4.19% |
| Market Rank | #5 |
| Bollinger Band Middle Line | $2.0189 |
| Global Crypto Sentiment Score | 20/100 (Extreme Fear) |
For institutional participants, this technical breakdown represents another data point in the ongoing assessment of XRP's viability as a core holding. The failure to maintain momentum above key technical levels reduces the asset's attractiveness for systematic strategies that rely on trend confirmation. Retail traders face increased risk of liquidity grabs below $1.85, where stop-loss clusters are likely concentrated. The broader implication extends to the altcoin market structure: XRP's inability to sustain rallies despite its top-5 market capitalization suggests capital rotation remains selective, with investors favoring assets demonstrating clearer regulatory pathways or stronger fundamental narratives. This aligns with recent outflows from spot ETH ETFs, indicating broader risk aversion beyond just XRP-specific concerns.
Market analysts on social platforms express cautious pessimism regarding XRP's near-term prospects. "The Bollinger Band rejection at the middle line creates a textbook sell setup," noted one quantitative trader with over 100,000 followers. "Until we see sustained volume above $2.02, this remains a distribution pattern." Another analyst highlighted the macroeconomic context: "With global risk assets facing pressure from elevated Fed Funds Rate expectations, crypto beta plays like XRP struggle to attract incremental capital." The prevailing sentiment suggests traders are positioning for further downside, with options flow indicating increased put buying at the $1.80 strike for January expiration.
Bullish Case: Should XRP reclaim and hold above the Bollinger Band middle line at $2.0189 with accompanying volume expansion, the next resistance zone appears at $2.25 (the 0.382 Fibonacci level). This scenario would require either a sudden shift in global risk sentiment or XRP-specific catalyst, such as favorable regulatory clarity from ongoing litigation. Bullish invalidation occurs at $1.78—a break below this Fibonacci support would negate any near-term recovery thesis.
Bearish Case: Continued failure below $2.0189 likely triggers a test of the $1.78 Fibonacci support, with potential extension toward the yearly low at $1.65 if broader market conditions deteriorate. The extreme fear sentiment score of 20/100 suggests limited buying appetite for speculative assets, increasing probability of further downside. Bearish invalidation requires a daily close above $2.25 with follow-through buying, which would indicate a structural shift in market dynamics.
What do Bollinger Bands indicate about XRP's price action?Bollinger Bands measure volatility and relative price levels. XRP trading below the middle band suggests bearish momentum and below-average prices relative to recent volatility.
Why is $2.0189 a critical level for XRP?This represents the Bollinger Band middle line (typically a 20-period moving average). Reclaiming this level would signal a shift from bearish to neutral momentum.
How does global crypto sentiment affect XRP?With sentiment at "Extreme Fear" (20/100), risk appetite is suppressed, making it difficult for speculative assets like XRP to attract sufficient buying pressure for sustained rallies.
What technical levels should traders watch?Key levels include resistance at $2.0189 (Bollinger Band middle), support at $1.78 (Fibonacci), and critical invalidation at $1.65 (yearly low).
Could regulatory developments change this outlook?Yes. Favorable resolution of ongoing litigation or regulatory clarity could fundamentally alter XRP's risk profile, potentially overriding current technical signals. For authoritative information on securities regulation, consult the SEC.gov website.
Source Note: Market data and factual reporting in this article are sourced from original reports. Commentary and analysis provided by CoinMarketBuzz.

Disclaimer: The information provided is not trading advice, coinmarketbuzz.com holds no liability for any investments made based on the information provided on this page. We strongly recommend independent research and/or consultation with a qualified professional before making any investment decisions.
coinmarketbuzz.com leverages advanced AI technology to analyze market data. All content is fact-checked and reviewed by our editorial team to ensure accuracy and neutrality.