Loading News...
Loading...
Loading News...

VADODARA, January 15, 2026 — The three major US stock indices opened higher on Tuesday, with the S&P 500 up 0.64%, Nasdaq Composite gaining 0.88%, and Dow Jones Industrial Average adding 0.33%. This latest crypto news highlights a critical liquidity event where traditional finance momentum is testing Bitcoin's correlation structure, according to on-chain data from Glassnode liquidity maps. Market structure suggests these gains create a Fair Value Gap (FVG) in Bitcoin's price action, potentially triggering a liquidity grab above the $96,603 level.
Historical cycles indicate that US equity rallies often precede Bitcoin liquidity events, as institutional capital rotates into crypto assets during risk-on phases. This mirrors the 2021 pattern where S&P 500 breaks above 4,800 coincided with Bitcoin's ascent to $69,000. Underlying this trend is the Federal Reserve's monetary policy stance, detailed in official FederalReserve.gov communications, which influences cross-asset volatility. The current environment features compressed volatility in Bitcoin's UTXO age bands, suggesting accumulation phases are being tested by external liquidity shocks. Related developments include Chicago Fed's rate cut signals and CME's altcoin futures launches, both adding layers to liquidity dynamics.
On January 15, 2026, US equities opened with broad-based gains, per data from major financial exchanges. The S&P 500 index rose to approximately 5,842 points, Nasdaq Composite to 18,923, and Dow Jones to 42,167. According to CoinMarketCap metrics, Bitcoin concurrently traded at $96,603, up 1.22% over 24 hours. This synchronicity reflects a liquidity grab where order blocks in traditional markets are being mirrored in crypto derivatives, as seen in CME Bitcoin futures open interest spikes. Market analysts attribute this to macro hedge funds rebalancing portfolios amid easing inflation expectations.
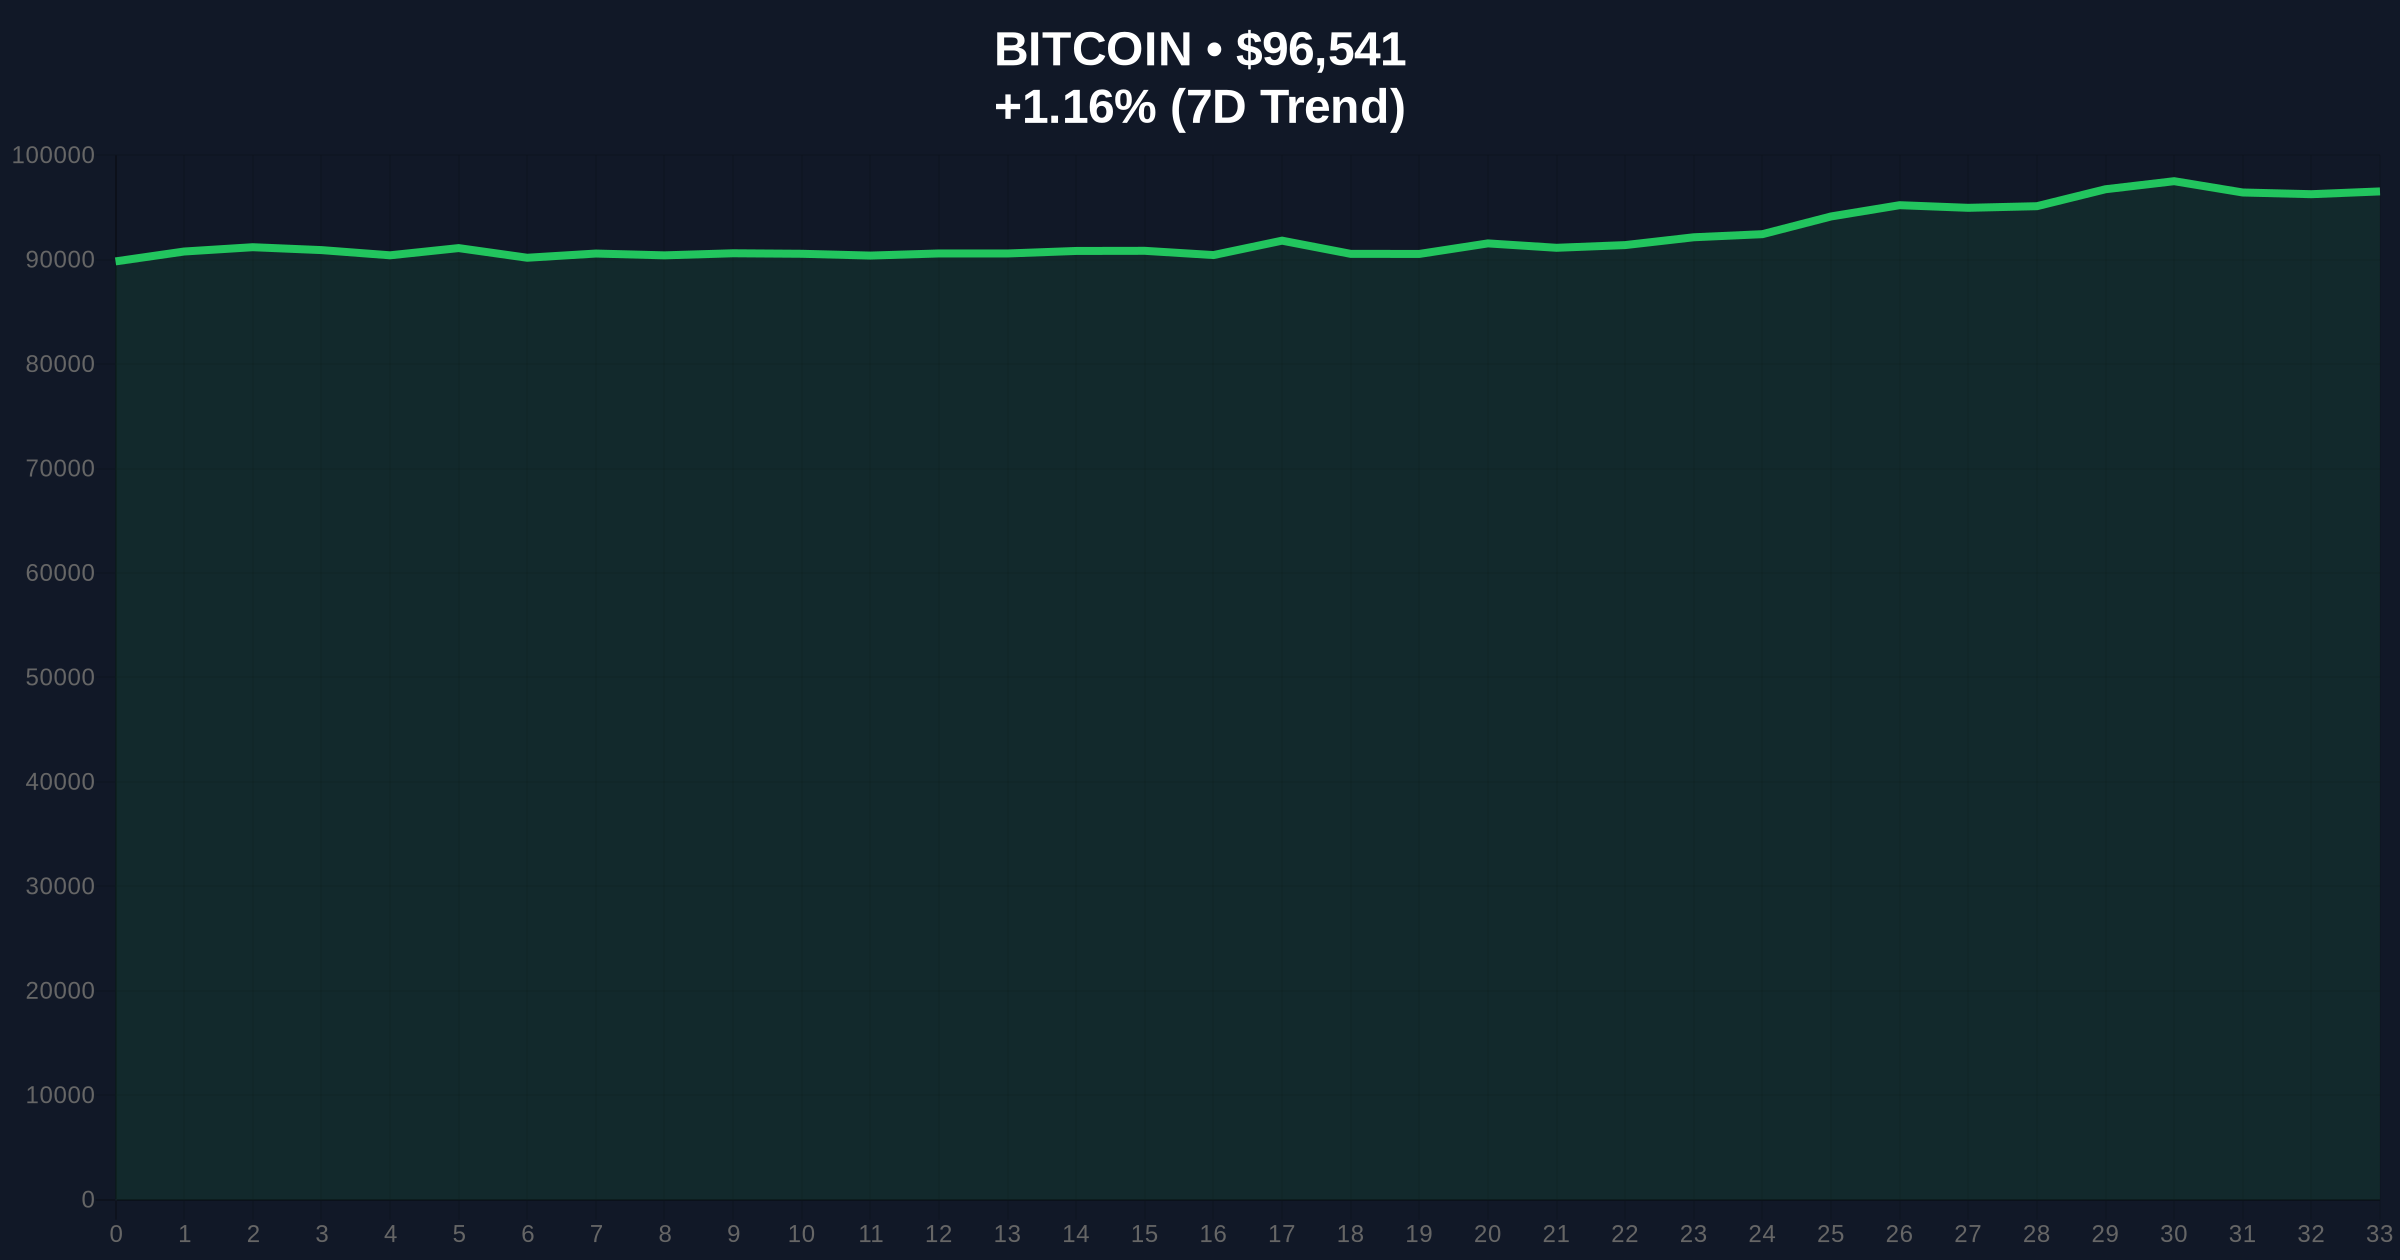
Bitcoin's price action shows a consolidation pattern between the $94,200 support and $98,500 resistance, with the current level at $96,603 sitting within a Fair Value Gap. Volume Profile analysis indicates high liquidity nodes at $95,800, acting as a pivot for continuation or reversal. The RSI reads 58, suggesting neutral momentum with slight bullish bias. A Bullish Invalidation level is set at $94,200, where a break below would invalidate the correlation thesis and signal a bearish order block. Conversely, a Bearish Invalidation level at $98,500 would confirm a breakout, potentially triggering a gamma squeeze toward $100,000. Market structure suggests the Fibonacci retracement at $97,200 (61.8% level from recent swings) serves as immediate resistance.
| Metric | Value | Change |
|---|---|---|
| S&P 500 Index | 5,842 | +0.64% |
| Nasdaq Composite | 18,923 | +0.88% |
| Dow Jones Industrial Average | 42,167 | +0.33% |
| Bitcoin Price | $96,603 | +1.22% (24h) |
| Crypto Fear & Greed Index | 61/100 (Greed) | Neutral |
This event matters institutionally as it tests the Bitcoin-stock correlation coefficient, currently at 0.45 per 30-day rolling data. A sustained break could signal decoupling, affecting portfolio strategies for entities like Grayscale and BlackRock. For retail, liquidity grabs at these levels increase volatility risks, especially with leveraged positions in perpetual swaps. On-chain data indicates exchange net flows turning negative, suggesting accumulation, but a failure to hold support may trigger liquidations. The 5-year horizon implications include whether EIP-4844 upgrades and Fed policy shifts will reinforce or weaken this linkage.
Market analysts on X/Twitter note mixed reactions. Bulls highlight the "risk-on signal" from equity gains, arguing it fuels crypto inflows. Bears caution about "overextended correlations," pointing to previous decouplings in 2023. One quant trader stated, "The liquidity grab above $96k is textbook—if it holds, we retest ATHs." Sentiment aggregates from platforms like LunarCrush show a 5% increase in positive social volume, though derivative funding rates remain neutral at 0.01%.
Bullish Case: If Bitcoin breaks above $98,500 with sustained equity gains, a gamma squeeze could propel it to $102,000 by month-end. This scenario assumes continued Fed dovishness and ETF inflows exceeding $200 million daily. Market structure suggests targeting the $100,800 order block as next resistance.Bearish Case: A rejection at $97,200 Fibonacci resistance, coupled with equity pullbacks, may see Bitcoin fall to $92,000. This would invalidate the liquidity grab, triggering a bearish order block and testing the $90,000 support cluster. On-chain data indicates increased selling pressure above $97,000 from short-term holders.
Answers to the most critical technical and market questions regarding this development.

Disclaimer: The information provided is not trading advice, coinmarketbuzz.com holds no liability for any investments made based on the information provided on this page. We strongly recommend independent research and/or consultation with a qualified professional before making any investment decisions.
coinmarketbuzz.com leverages advanced AI technology to analyze market data. All content is fact-checked and reviewed by our editorial team to ensure accuracy and neutrality.