Loading News...
Loading...
Loading News...

VADODARA, February 9, 2026 — Solana (SOL) faces a critical technical breakdown as a bearish head and shoulders pattern confirms on its monthly chart, according to a Cointelegraph analysis citing multiple experts. This daily crypto analysis reveals SOL has already plunged 72% from its January 2025 peak, with the pattern signaling a potential drop below $50. Market structure suggests this move could extend to $30 without clear support, challenging the network's post-FTX resilience narrative.
According to the Cointelegraph report, Solana's SOL/USD monthly chart has formed a bearish head and shoulders pattern over the past two years. The analysis notes SOL has dropped 72% from its January 2025 all-time high, confirming a downward break from this classic reversal pattern. Experts cited in the report indicate this breakdown signals a potential fall below the $50 psychological level. The pattern's measured move projects a target as low as $30, with no established support zone identified in that region. This technical formation represents a significant shift in market structure that contradicts bullish narratives around Solana's throughput advantages.
Historically, head and shoulders patterns have preceded major trend reversals across asset classes. In contrast to Solana's current situation, Bitcoin's 2018 bear market saw similar patterns that validated over multiple timeframes. Underlying this trend is Solana's 72% decline from its peak, which mirrors the drawdowns experienced by altcoins during previous crypto winters. The network's recovery from the FTX collapse in 2022 created a narrative of resilience that current price action challenges. , the broader market faces similar pressures, as seen in recent Bitcoin volatility amid extreme fear sentiment.
Market-wide stress is evident across multiple platforms. Upbit has suspended POKT transfers during network upgrades, while Bithumb implemented similar measures. Concurrently, GRVT's institutional-focused event in Hong Kong highlights how platforms are adapting to volatile conditions. These actions reflect the operational challenges exchanges face during periods of extreme market fear.
Market structure suggests the head and shoulders pattern represents a significant Fair Value Gap (FVG) between current prices and fundamental valuation metrics. The $50 level now serves as critical psychological support, with a break below likely triggering stop-loss cascades. On-chain data indicates weakening holder conviction, as evidenced by increasing token velocity on Solana's blockchain. The monthly chart's breakdown invalidates the bullish order block established during Solana's 2023 recovery. Without intervention at the protocol level—such as accelerated burn mechanisms or staking yield adjustments—technical pressure may intensify. According to Ethereum's official documentation on network security, sustained price declines can impact validator economics in proof-of-stake systems, a relevant consideration for Solana's similar architecture.
| Metric | Value | Context |
|---|---|---|
| Crypto Fear & Greed Index | 14/100 (Extreme Fear) | Indicates potential capitulation phase |
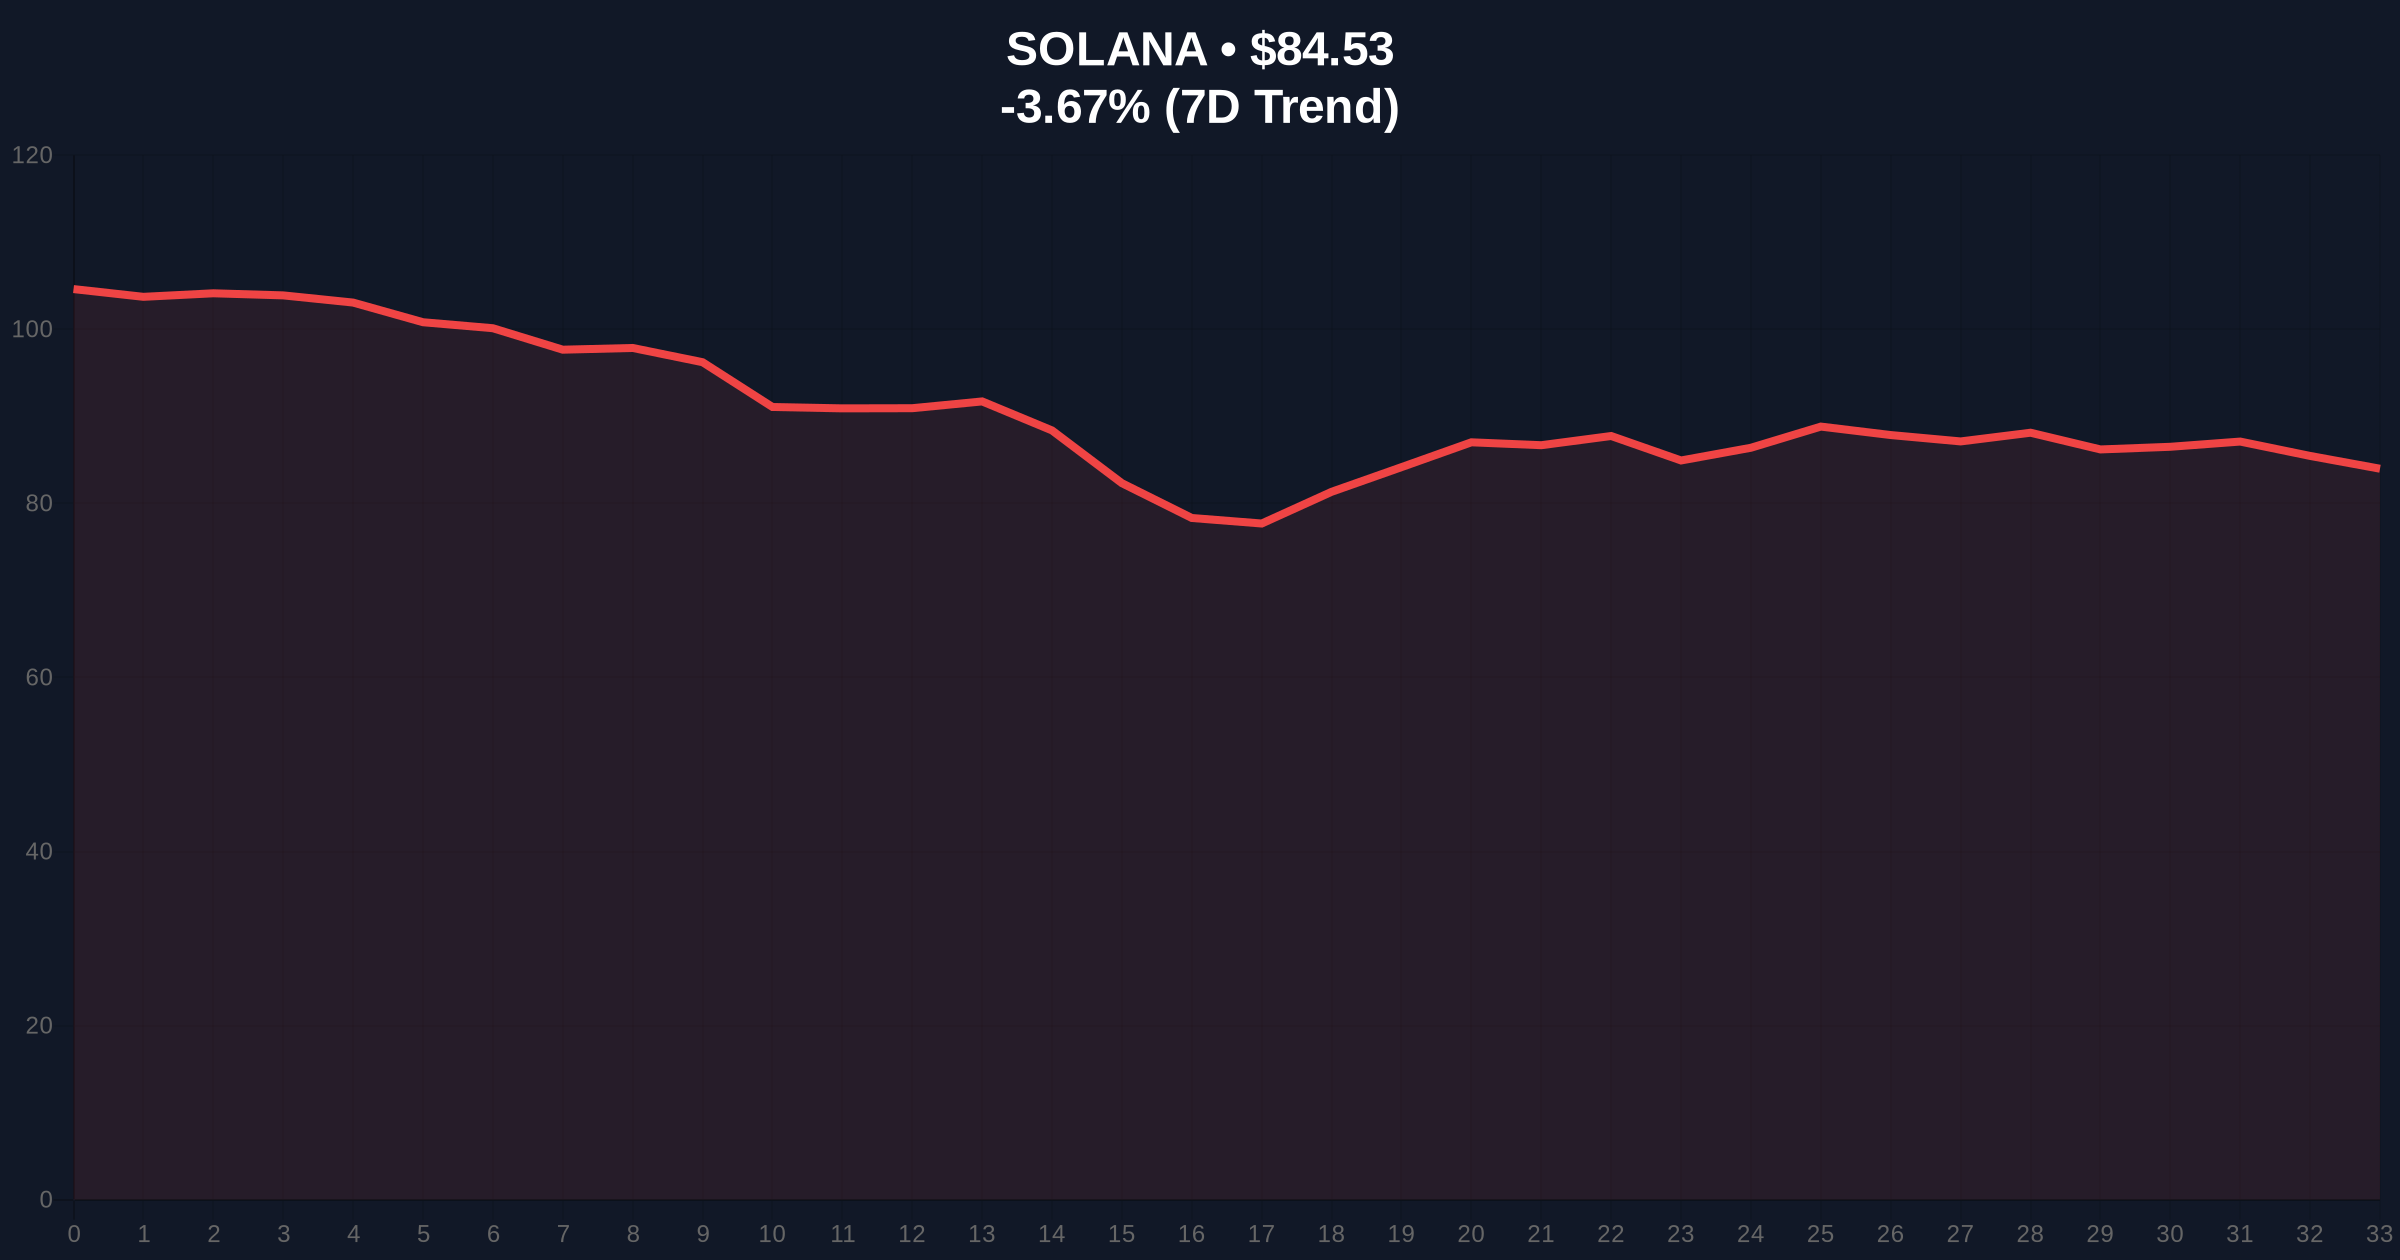
| SOL Current Price | $84.53 | Down 72% from Jan 2025 ATH |
| SOL 24h Trend | -3.67% | Continuing downward momentum |
| SOL Market Rank | #7 | Maintaining top-10 position |
| Pattern Target | $30-$50 | Head & shoulders measured move |
This technical breakdown matters because it challenges Solana's institutional adoption thesis. A drop below $50 would represent a 80%+ decline from all-time highs, testing the network's economic security model. Historical cycles suggest such drawdowns often precede fundamental reassessments of blockchain value propositions. The extreme fear sentiment (score: 14/100) creates conditions for liquidity grabs by sophisticated players. Retail market structure appears vulnerable, with many holders entering at higher prices during the 2024-2025 rally. Institutional liquidity cycles typically rotate away from assets showing such technical deterioration, potentially accelerating the downward momentum.
"The monthly head and shoulders pattern represents a significant shift in Solana's market structure. While the network's technical fundamentals remain strong, price action suggests a decoupling from on-chain metrics. The $50 level now serves as a critical litmus test for investor conviction." — CoinMarketBuzz Intelligence Desk
Market structure suggests two primary scenarios based on current technical formations. The bearish scenario projects a measured move to the $30-$50 range, potentially creating a new accumulation zone. The bullish scenario requires reclaiming the pattern's neckline and establishing higher lows above $100. Historical patterns indicate such breakdowns often resolve over 6-12 month timeframes, making this a critical period for Solana's market positioning.
The 12-month institutional outlook depends on Solana's ability to maintain developer activity and network usage during price declines. The 5-year horizon suggests blockchain value accrual correlates more with utility than short-term price action, but current technicals indicate a challenging period ahead for SOL holders.

Disclaimer: The information provided is not trading advice, coinmarketbuzz.com holds no liability for any investments made based on the information provided on this page. We strongly recommend independent research and/or consultation with a qualified professional before making any investment decisions.
coinmarketbuzz.com leverages advanced AI technology to analyze market data. All content is fact-checked and reviewed by our editorial team to ensure accuracy and neutrality.