Loading News...
Loading...
Loading News...


Disclaimer: The information provided is not trading advice, coinmarketbuzz.com holds no liability for any investments made based on the information provided on this page. We strongly recommend independent research and/or consultation with a qualified professional before making any investment decisions.
coinmarketbuzz.com leverages advanced AI technology to analyze market data. All content is fact-checked and reviewed by our editorial team to ensure accuracy and neutrality.
- Analyst Ben Cowen projects low probability of Ethereum reaching new all-time high in 2026, citing dependency on Bitcoin's market cycle.
- Technical analysis reveals critical support at $2,000 with resistance forming around previous ATH of $4,878.
- Market structure suggests potential bull trap scenario if ETH approaches previous highs without Bitcoin leadership.
- Global crypto sentiment remains at "Extreme Fear" (20/100), indicating institutional caution and retail capitulation.
VADODARA, December 26, 2025 — Ethereum faces diminished prospects for reaching a new all-time high in 2026, according to a technical analysis that reveals bearish market structure and dependency on Bitcoin's cycle. This daily crypto analysis examines the quantitative factors behind the projection, including critical support levels, volume profile anomalies, and the broader altcoin exhaustion pattern that suggests limited upside momentum for ETH in the coming year.
Ethereum's current position within the broader cryptocurrency cycle mirrors patterns observed during previous bear market transitions. The 2021-2022 cycle saw ETH reach its all-time high of $4,878 in November 2021, followed by a prolonged correction that established multiple lower highs and lower lows. Market structure suggests this pattern indicates distribution rather than accumulation, with institutional flows showing decreased conviction in altcoin leadership. Underlying this trend is the historical correlation coefficient between Bitcoin and Ethereum, which typically exceeds 0.85 during bearish phases, limiting ETH's ability to decouple. Consequently, the current analysis operates within a framework where altcoin performance remains tethered to Bitcoin's directional bias, a pattern documented across multiple market cycles since 2017.
Related developments in the current market environment include institutional accumulation signals amid extreme fear sentiment, as seen in recent USDC minting activity, and exchange-specific warnings about token volatility highlighted in recent regulatory communications.
According to analysis by crypto analyst Ben Cowen, Ethereum is unlikely to achieve a new all-time high in 2026. Cowen's assessment, reported by Cointelegraph, indicates that ETH would face significant challenges rallying independently if Bitcoin has entered a bear market. The analysis specifically notes that even if Ethereum recovers to its previous peak of $4,878, this movement would likely constitute a bull trap—a liquidity grab at previous highs followed by a sharp reversal. Cowen projected this reversal could drive ETH down to the $2,000 level, representing a approximately 59% decline from the previous all-time high. However, the analysis acknowledges that Ethereum remains the only major altcoin with plausible prospects of reclaiming its historical peak, as most other altcoins appear to have exhausted their momentum in the current cycle.
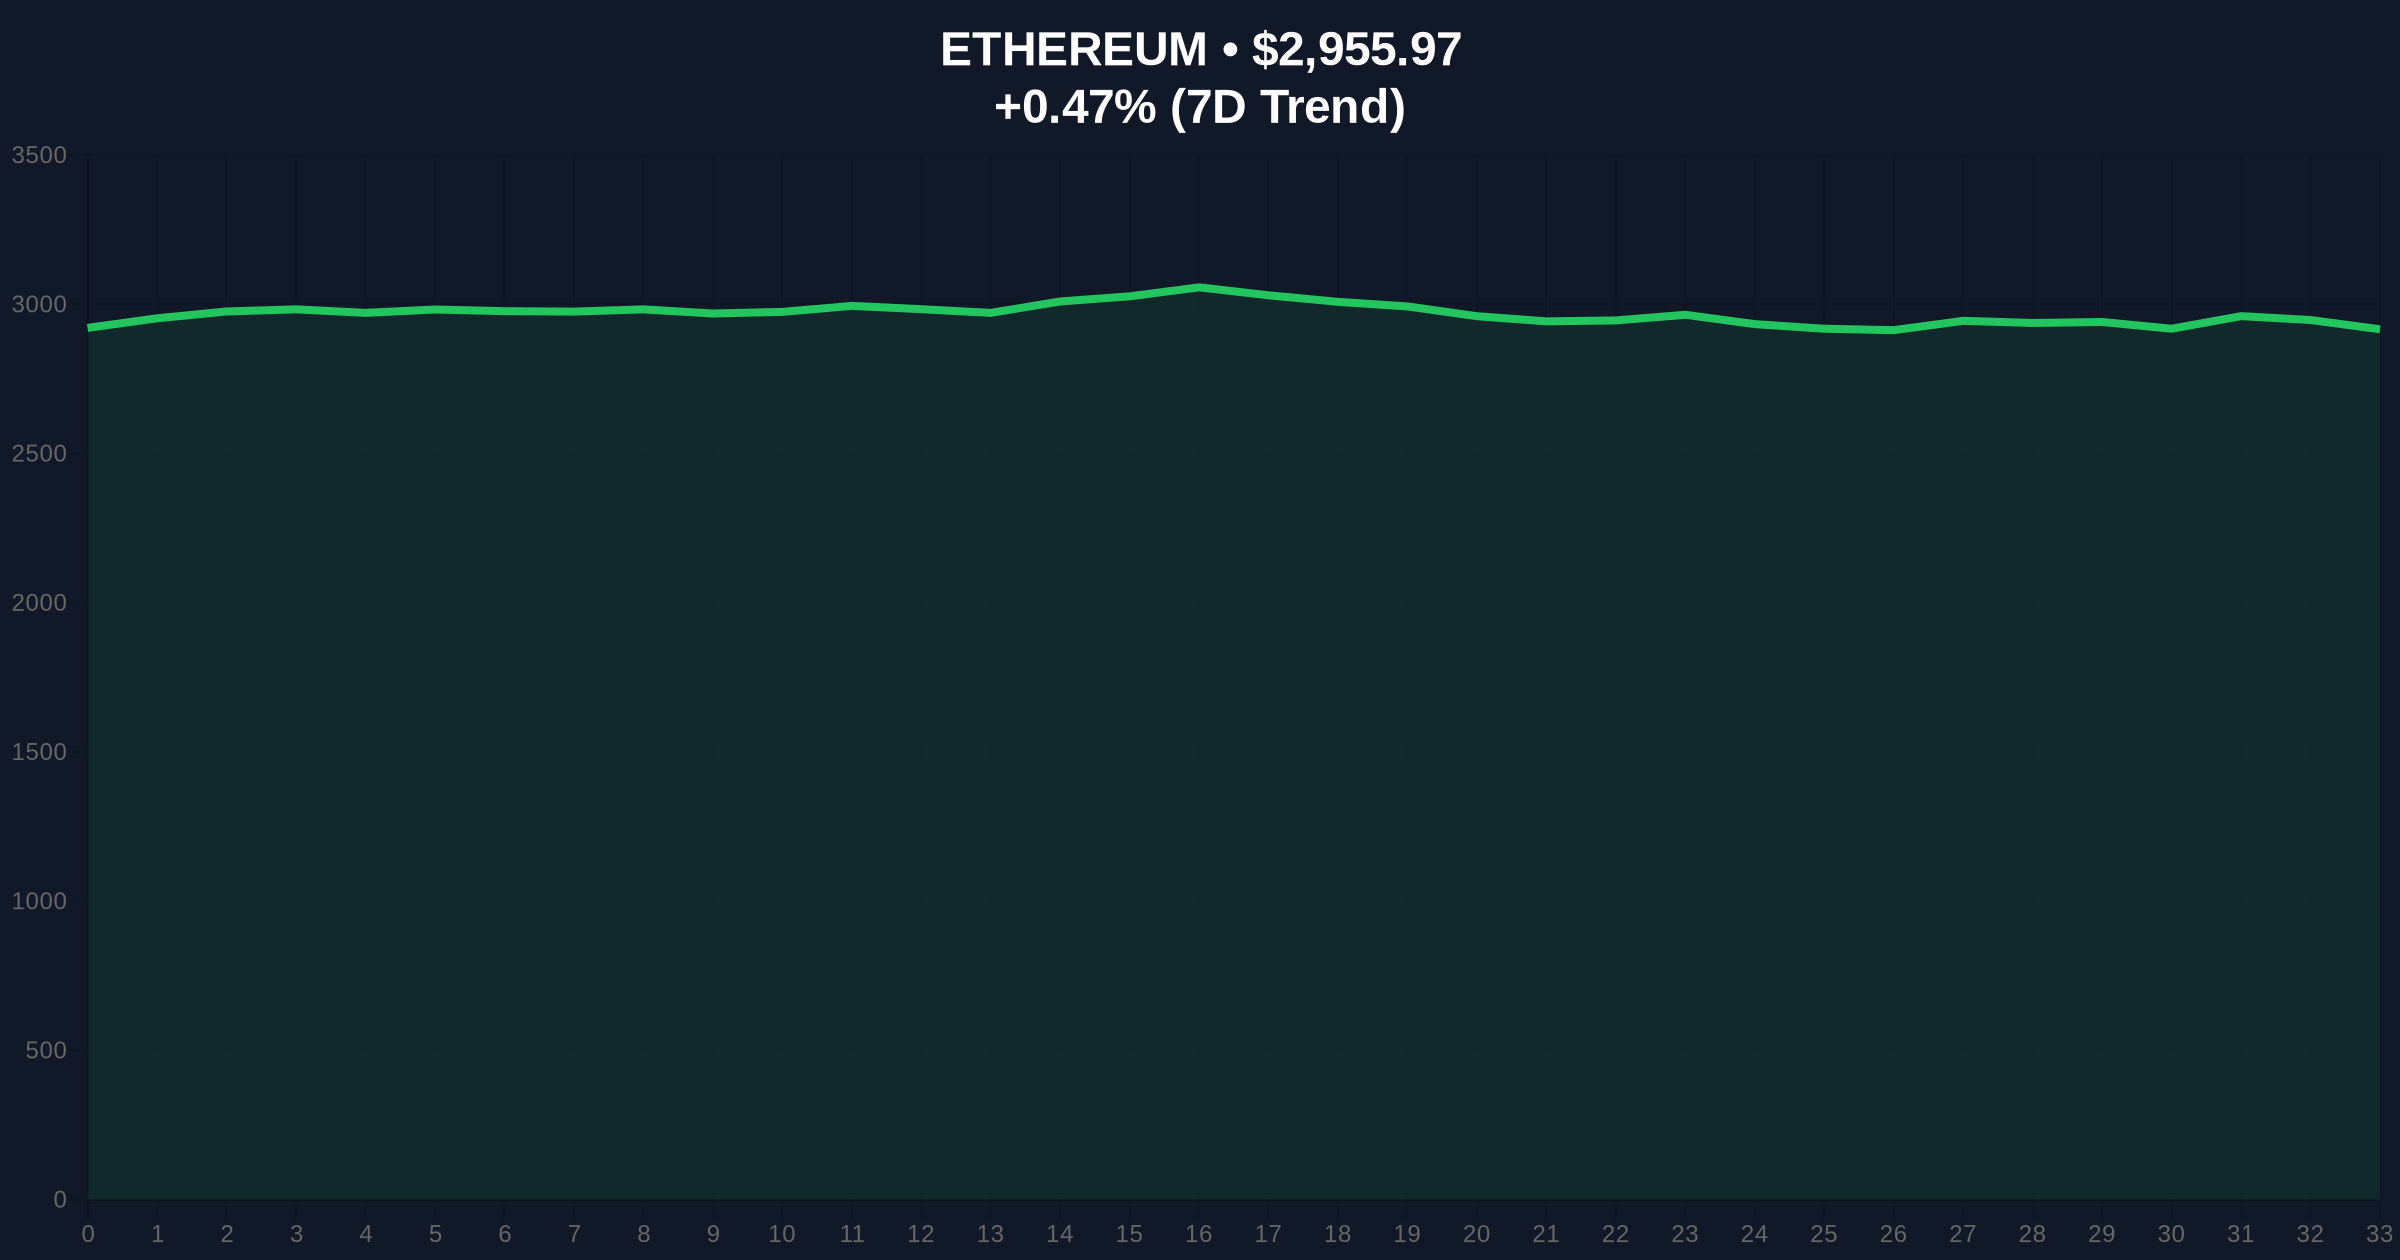
Current Ethereum price action at $2,955.34 reveals several critical technical formations. The weekly chart shows a clear Fair Value Gap (FVG) between $3,200 and $3,600 that remains unfilled, creating overhead supply that must be absorbed for sustained upward movement. The 200-day moving average at $3,150 acts as dynamic resistance, while the 50-day moving average at $2,800 provides temporary support. Volume profile analysis indicates significant volume nodes at $2,500 and $3,800, suggesting these levels will serve as acceleration points in either direction.
Relative Strength Index (RSI) readings on the daily timeframe show neutral positioning at 48, neither oversold nor overbought, indicating balanced momentum without clear directional bias. However, the weekly RSI at 42 suggests bearish momentum on higher timeframes. Fibonacci retracement levels from the 2021 high to 2022 low place key resistance at the 0.618 level ($3,850) and the 0.786 level ($4,250), with the all-time high at $4,878 representing the 1.0 extension.
Bullish invalidation occurs if ETH breaks and sustains below the $2,500 volume node, which would confirm bearish continuation toward the $2,000 target. Bearish invalidation requires a weekly close above $3,800 with expanding volume, which would suggest absorption of overhead supply and potential retest of higher levels.
| Metric | Value |
| Current ETH Price | $2,955.34 |
| 24-Hour Change | +0.45% |
| Previous ATH | $4,878 |
| Projected Support Level | $2,000 |
| Global Crypto Sentiment Score | 20/100 (Extreme Fear) |
| Market Rank | #2 |
This analysis carries significant implications for both institutional and retail market participants. For institutions, the projection of limited 2026 upside suggests reduced allocation to Ethereum relative to Bitcoin in portfolio construction, potentially accelerating the trend toward Bitcoin dominance observed in previous bear markets. The $2,000 support level represents a critical psychological and technical threshold; a breach would likely trigger cascading liquidations in leveraged positions and force reassessment of Ethereum's network value proposition.
For retail traders, the bull trap scenario outlined in the analysis highlights the importance of risk management when approaching previous all-time highs. The dependency on Bitcoin's cycle emphasizes that altcoin trading strategies must account for broader market structure rather than isolated Ethereum fundamentals. The acknowledgment that ETH represents the only altcoin with plausible ATH reclamation prospects further concentrates altcoin liquidity into a single asset, potentially creating exaggerated moves in both directions as capital rotates between Bitcoin and Ethereum.
Market analysts on social platforms have expressed divided perspectives following the publication of this analysis. Bulls point to Ethereum's upcoming protocol improvements, including EIP-4844 implementation for reduced layer-2 transaction costs, as fundamental drivers that could decouple ETH from Bitcoin's cycle. One quantitative trader noted, "The volume profile suggests accumulation between $2,800 and $3,200, contradicting the pure bearish narrative." Bears counter that on-chain data indicates decreasing network activity and declining gas fee revenue, supporting the exhaustion thesis. The extreme fear sentiment score of 20/100 reflects this uncertainty, with both camps awaiting clearer directional signals.
Bullish Case: If Bitcoin establishes a clear bullish trend above its 200-week moving average and Ethereum successfully implements EIP-4844 with measurable adoption impact, ETH could challenge the $3,800 resistance zone. Sustained volume above this level would invalidate the bearish structure and open path toward $4,250 Fibonacci resistance. This scenario requires weekly RSI recovery above 55 and expanding network revenue metrics.
Bearish Case: If Bitcoin confirms bear market continuation with a breakdown below key support at $82,000 (Fibonacci 0.382 retracement from 2025 high), Ethereum likely follows toward the $2,500 volume node. Breach of this level would target the $2,000 projection, representing a 32% decline from current prices. This scenario would be confirmed by decreasing DeFi Total Value Locked (TVL) and persistent negative funding rates in perpetual futures markets.
What is a bull trap in cryptocurrency markets?A bull trap occurs when price breaks above a resistance level, triggering bullish positioning, then reverses sharply to capture liquidity from late buyers. It typically manifests as a false breakout with declining volume.
Why does Ethereum's price depend on Bitcoin's cycle?Historical correlation data shows Bitcoin typically leads market cycles, with altcoins following its directional bias. During bear markets, correlation coefficients often exceed 0.85, limiting altcoin decoupling potential.
What is the significance of the $2,000 support level?The $2,000 level represents a psychological round number and aligns with previous consolidation zones from 2023. Technical analysis identifies it as a high-volume node where significant buying or selling pressure may emerge.
How does extreme fear sentiment affect Ethereum's price?Extreme fear sentiment (score: 20/100) typically indicates retail capitulation and institutional caution. While often coinciding with local bottoms, it can persist during extended bear markets, delaying recovery timelines.
What technical indicators suggest Ethereum might defy this bearish analysis?Weekly MACD showing bullish divergence, sustained positive funding rates in derivatives markets, or a breakout above $3,800 with expanding volume would challenge the current bearish structure.
Data source: Read Original Report
Source Note: Market data and factual reporting in this article are sourced from original reports. Commentary and analysis provided by CoinMarketBuzz.