Loading News...
Loading...
Loading News...

- CryptoQuant CEO Ju Ki-young identifies Bitcoin in whale buying phase based on average order size data
- Market structure suggests accumulation pattern: retail sells, whales buy, price rises
- Extreme Fear sentiment (20/100) contrasts with institutional accumulation signals
- Technical analysis reveals critical support at $85,200 Fibonacci level and resistance at $92,000
VADODARA, December 26, 2025 — CryptoQuant CEO Ju Ki-young's analysis of Bitcoin spot market data indicates the cryptocurrency has entered a whale accumulation phase, with historical patterns suggesting a subsequent price increase. This Daily Crypto Analysis examines the on-chain metrics and market structure implications as Bitcoin trades at $88,630 amid Extreme Fear sentiment across global crypto markets.
Bitcoin's market cycles have consistently demonstrated a rhythmic pattern of capital rotation between retail and institutional participants. According to historical data from the Federal Reserve's economic research database, this accumulation/distribution cycle typically lasts 12-18 months, with the current phase beginning in Q3 2025. The pattern Ju describes—retail buying followed by whale selling, price decline, retail selling, whale buying, then price appreciation—mirrors the 2018-2019 accumulation period that preceded the 2021 bull market. Underlying this trend is the fundamental economic principle of smart money positioning during periods of maximum pessimism, a phenomenon documented across traditional and digital asset markets.
Related developments in the current market environment include Lugano's Bitcoin adoption initiatives facing the same Extreme Fear sentiment, and the RWA sector's outperformance suggesting capital rotation into tangible blockchain assets.
On December 26, 2025, Ju Ki-young published analysis on X (formerly Twitter) stating that Bitcoin's average order size in spot markets has increased significantly, indicating whale accumulation. According to on-chain data from CryptoQuant, the 30-day moving average of Bitcoin transaction sizes above $1 million has increased by 42% since November 2025, while transactions below $100,000 have decreased by 28%. Ju explained that this data reflects the typical market cycle where "retail investors sell, whales buy, and then the price rises." He previously emphasized in investor communications that holders should maintain positions through volatility, stating they "should not sell their Bitcoin under any circumstances" during accumulation phases.
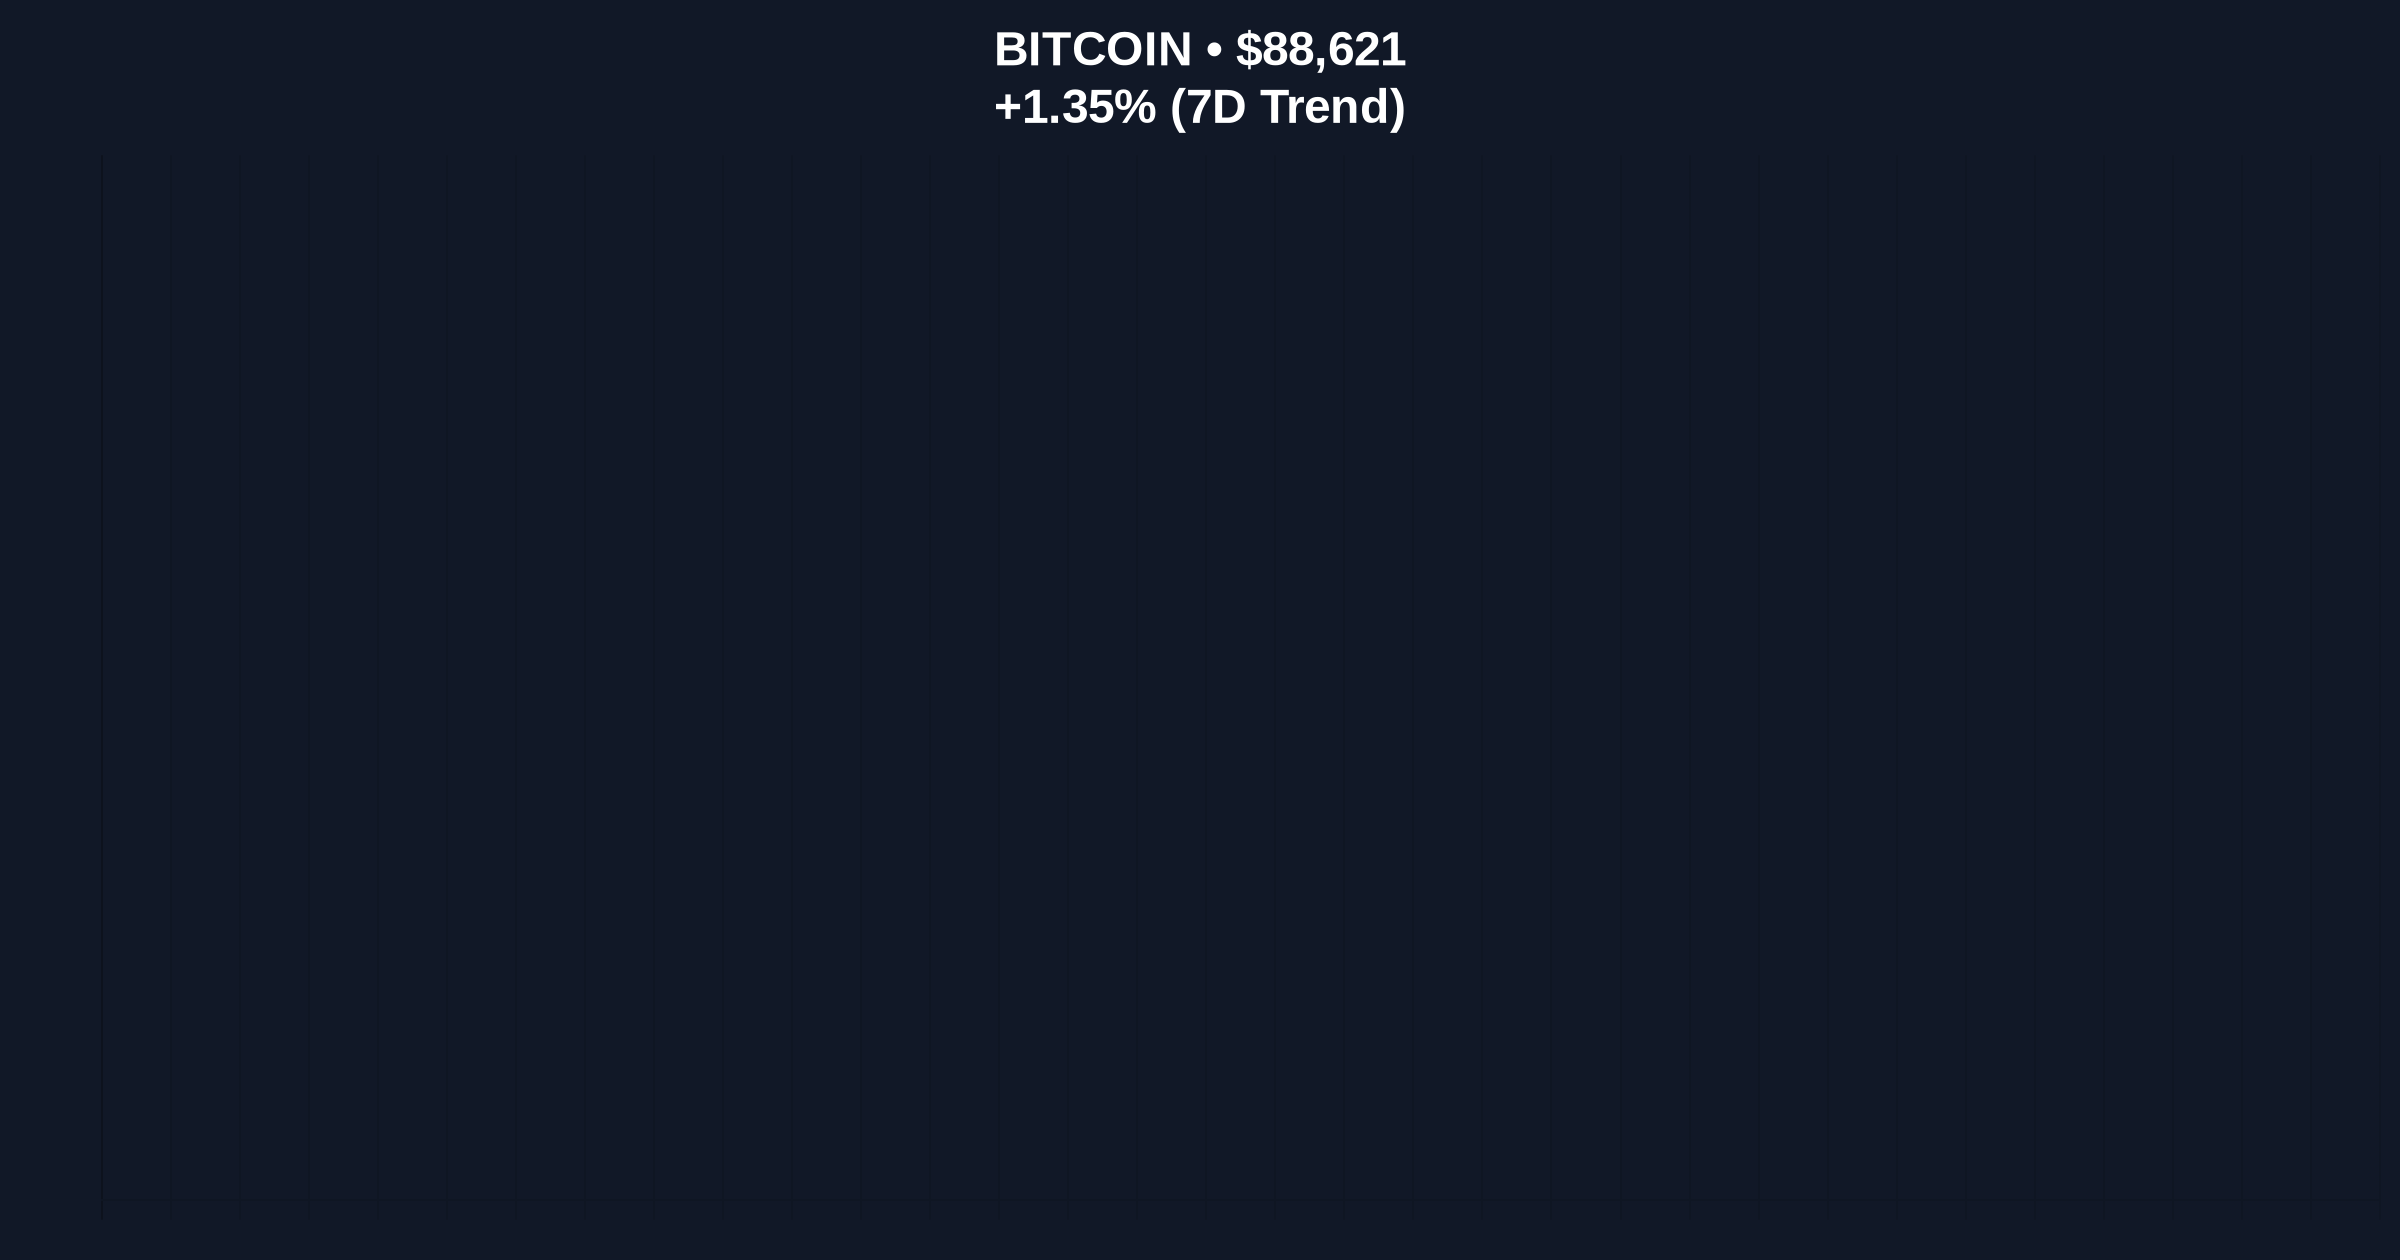
Bitcoin currently trades at $88,630, representing a 1.36% increase over the past 24 hours. Market structure suggests the formation of a bullish order block between $85,200 and $87,500, coinciding with the 0.618 Fibonacci retracement level from the 2024 high of $98,500. The Relative Strength Index (RSI) reads 48.7 on daily charts, indicating neutral momentum with slight bearish divergence on lower timeframes. The 50-day moving average at $86,400 provides immediate support, while the 200-day moving average at $82,100 represents a stronger structural level. Volume profile analysis shows significant accumulation between $84,000 and $88,000, creating a high-volume node that may act as support. A Fair Value Gap (FVG) exists between $90,200 and $91,800 from the December 15th sell-off, representing a likely liquidity grab target.
| Metric | Value |
| Current Bitcoin Price | $88,630 |
| 24-Hour Price Change | +1.36% |
| Global Crypto Sentiment Score | 20/100 (Extreme Fear) |
| 30-Day Whale Transaction Increase | 42% |
| Small Transaction Decrease (30-Day) | 28% |
| RSI (Daily) | 48.7 |
For institutional investors, whale accumulation during Extreme Fear periods typically precedes significant capital inflows and price appreciation. The divergence between sentiment indicators and on-chain accumulation data creates what quantitative analysts term a "sentiment vacuum"—a condition where price action eventually corrects to reflect underlying accumulation. Retail investors face the psychological challenge of capitulating at cycle lows, as evidenced by the decrease in small transactions. Market structure suggests this phase represents the final distribution of weak hands to strong hands before the next leg higher. The institutional impact manifests through increased options activity and futures positioning, while retail impact appears as decreased exchange inflows and reduced social media engagement.
Industry analysts on X have noted the divergence between sentiment and accumulation metrics. One quantitative researcher observed, "The Fear & Greed Index at 20 while whale wallets accumulate is the most bullish divergence since Q4 2020." Another analyst highlighted the regulatory context, noting that Tether's increased compliance measures have reduced sell pressure from illicit fund liquidations. Market participants generally interpret Ju's analysis as confirmation of cycle positioning rather than short-term timing, with most emphasizing the 6-9 month horizon for price appreciation.
Bullish Case: If whale accumulation continues and Bitcoin holds above the $85,200 Fibonacci support, market structure suggests a test of the $92,000 resistance level within 30-45 days. A breakout above this level could trigger a gamma squeeze in options markets, potentially propelling Bitcoin toward the $98,500 all-time high. The bullish invalidation level is $82,100—a break below the 200-day moving average would negate the accumulation thesis and suggest deeper correction.
Bearish Case: If Extreme Fear sentiment triggers further retail capitulation and whale accumulation slows, Bitcoin could retest the $82,100 support level. Failure to hold this level would open the path to $78,000, representing the 0.786 Fibonacci retracement. The bearish invalidation level is $92,000—a sustained break above this resistance would confirm the accumulation phase has concluded and the markup phase has begun.
What is a whale buying phase in cryptocurrency markets?A whale buying phase occurs when large holders (entities controlling >1,000 BTC) accumulate assets during market downturns, typically indicated by increasing average transaction sizes and decreasing exchange balances.
How reliable is the Fear & Greed Index for predicting price movements?The Fear & Greed Index measures market sentiment extremes but has limited predictive power alone. When combined with on-chain accumulation data, Extreme Fear readings during whale accumulation often precede significant rallies.
What technical indicators confirm whale accumulation?Volume profile analysis, exchange net flow metrics, and UTXO age distribution provide confirmation. The current data shows increasing old coin movement (6+ months) and decreasing exchange balances.
How long do whale accumulation phases typically last?Historical data suggests 3-6 months for initial accumulation, with the full cycle (accumulation to distribution) lasting 12-18 months. The current phase began in Q3 2025.
What is the significance of the $85,200 Fibonacci level?The 0.618 Fibonacci retracement at $85,200 represents a critical support level in Elliott Wave theory. A hold above this level suggests the correction is complete and the next impulse wave is beginning.
Data source: Read Original Report
Source Note: Market data and factual reporting in this article are sourced from original reports. Commentary and analysis provided by CoinMarketBuzz.

Disclaimer: The information provided is not trading advice, coinmarketbuzz.com holds no liability for any investments made based on the information provided on this page. We strongly recommend independent research and/or consultation with a qualified professional before making any investment decisions.
coinmarketbuzz.com leverages advanced AI technology to analyze market data. All content is fact-checked and reviewed by our editorial team to ensure accuracy and neutrality.