Loading News...
Loading...
Loading News...

- Bitcoin attempts to break a two-month downtrend line established since October 2025
- $24 billion in options set to expire, potentially reducing hedging pressure on price action
- Technical analysis suggests breakout target of $95,000 with potential extension to $100,000
- Market structure shows similarities to 2021 consolidation patterns before major rallies
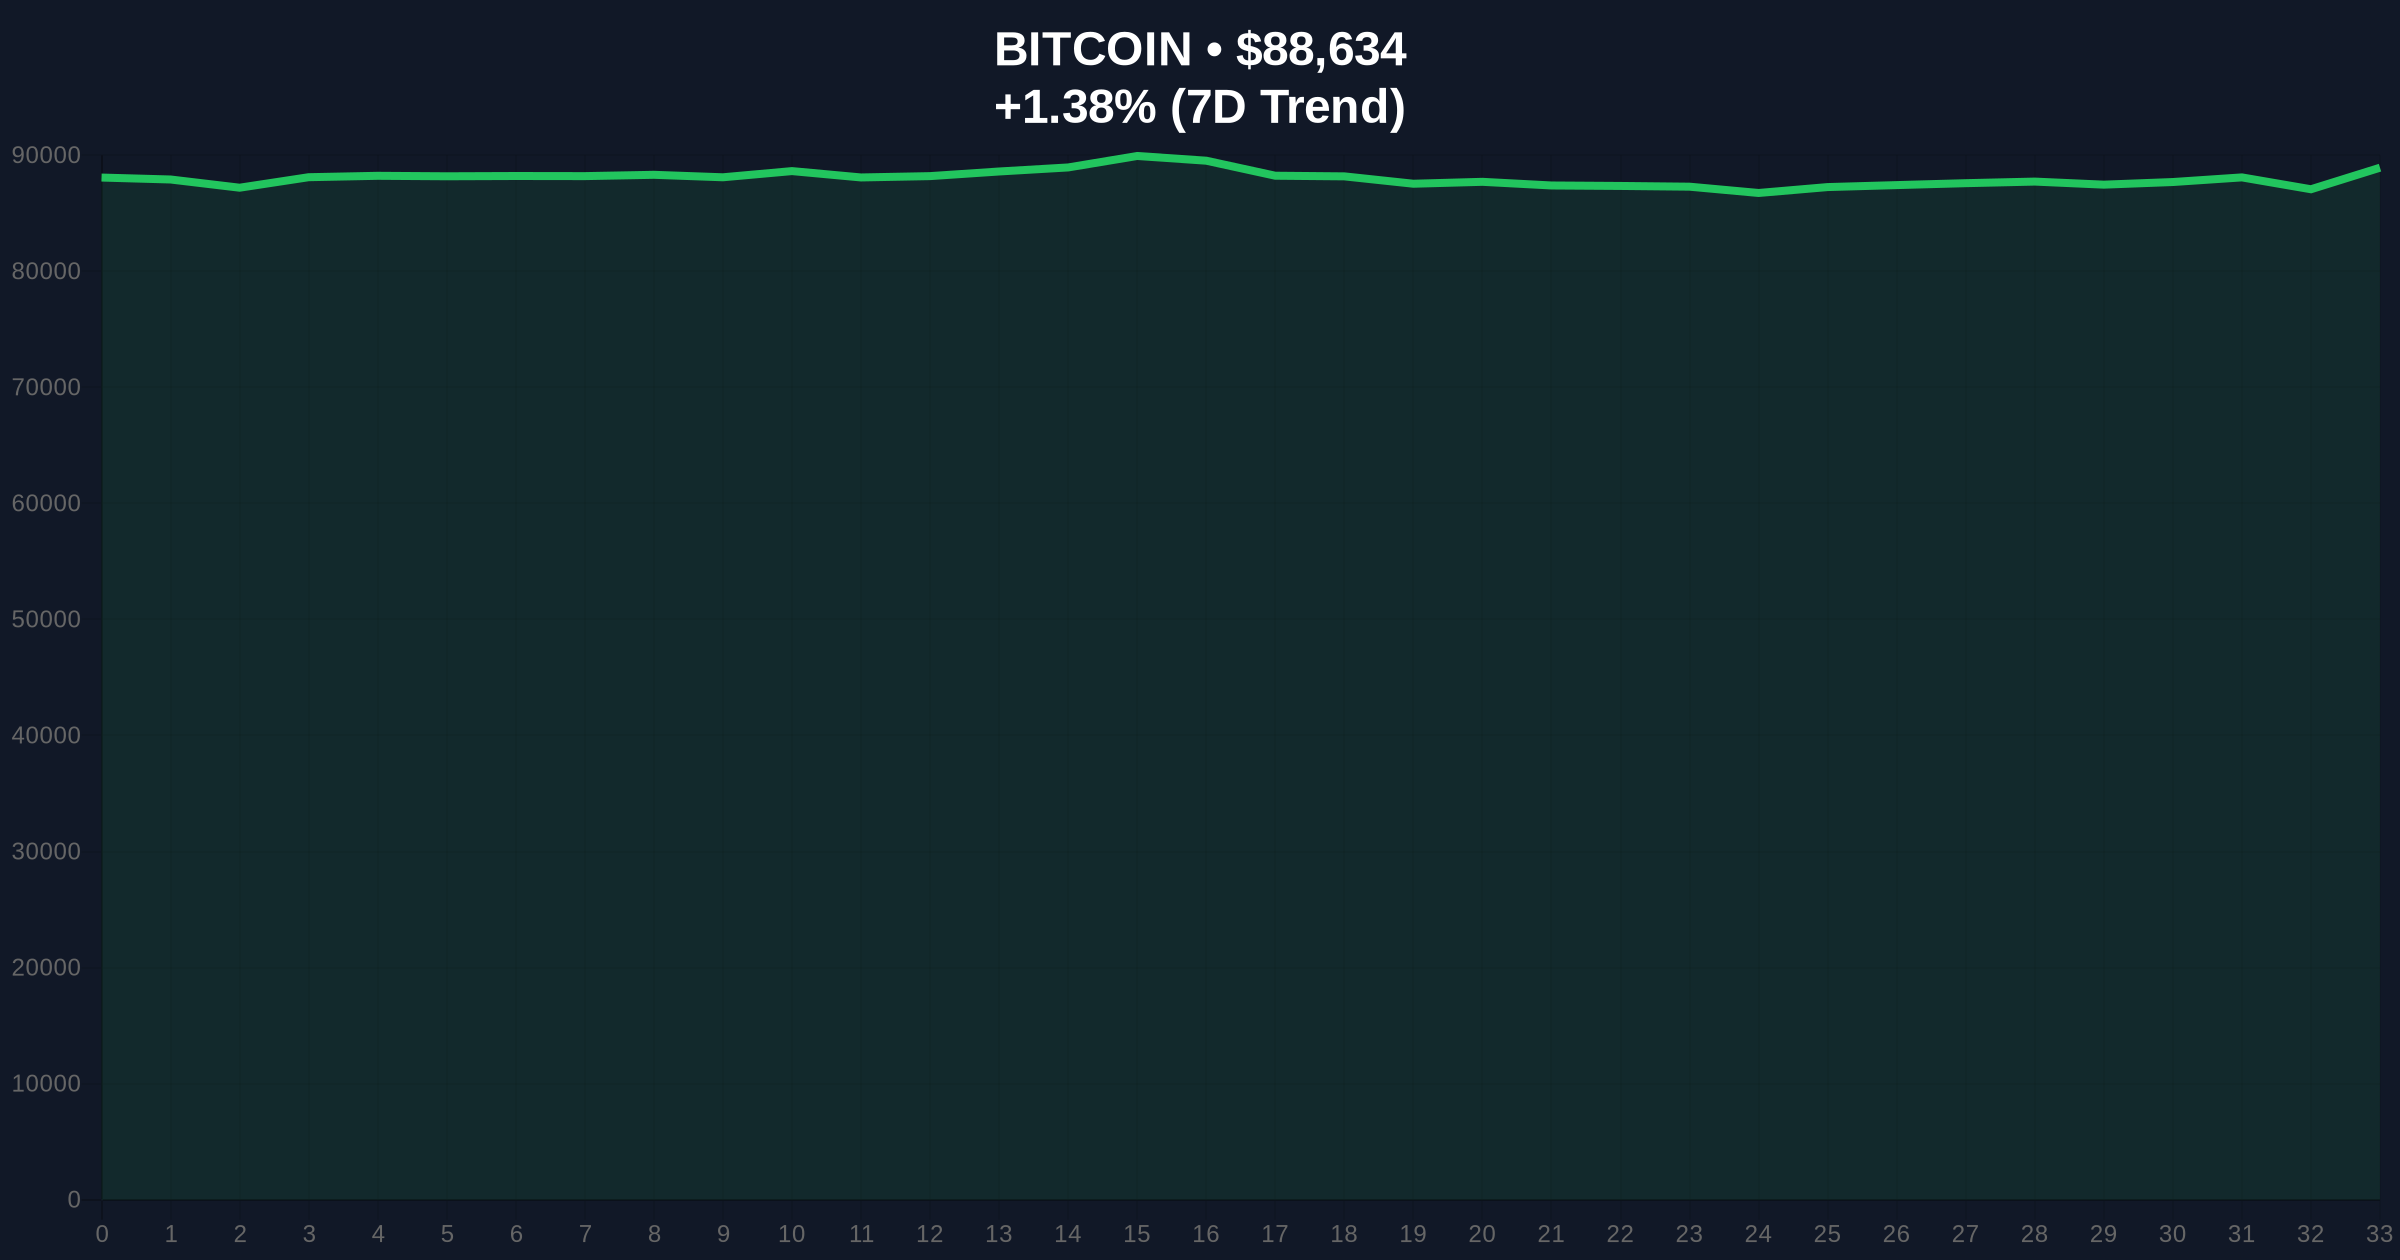
VADODARA, December 26, 2025 — Bitcoin is testing a critical technical breakout in today's daily crypto analysis, attempting to reverse a downtrend that has persisted since October as approximately $24 billion in options approach expiration. According to multiple analyses, this convergence of technical and derivatives factors could provide the catalyst for a sustained move toward the $95,000 resistance level, with market structure suggesting potential for further upside toward six-figure territory.
Market structure indicates Bitcoin has been consolidating within a descending channel since October 2025, mirroring the 2021 correction pattern where BTC established a multi-month base before the final parabolic advance to its all-time high. The current technical setup shows striking similarities to that historical precedent, with price action compressing against a well-defined downtrend line while on-chain metrics suggest accumulation at these levels. According to on-chain data, long-term holders have been increasing their positions during this consolidation phase, creating what technical analysts refer to as an Order Block—a zone where institutional buying typically establishes support before major moves.
This pattern resembles the 2021 Q3 consolidation where Bitcoin traded between $40,000 and $50,000 for approximately three months before breaking out toward $69,000. The current compression against the downtrend line, combined with extreme fear sentiment registering at 20/100 on the Crypto Fear & Greed Index, creates conditions historically associated with significant trend reversals. Related developments in this extreme fear environment include Peter Schiff's recent exit call and Caroline Ellison's early release, both occurring amid similar market psychology.
On December 26, 2025, multiple technical analysts identified Bitcoin's attempt to break above a two-month resistance line that has contained price action since October. According to a statement from Crypto Ideology, the daily candle is testing this downtrend boundary, with a successful break potentially triggering a move toward $95,000. Separately, trader BitBull, who maintains 470,000 followers on X, noted that approximately $24 billion in Bitcoin options are approaching expiration, which could reduce the hedging pressure that has suppressed prices in recent weeks.
Market analysts suggest this options expiry could create what derivatives traders refer to as a Gamma Squeeze scenario, where reduced dealer hedging activity allows for cleaner price discovery. Adding to the technical narrative, crypto analyst Michaël van de Poppe commented that the broader cryptocurrency market remains undervalued relative to historical metrics and could reach new all-time highs in the coming months. This convergence of technical factors—downtrend resistance testing, massive options expiry, and undervaluation signals—creates what quantitative analysts describe as a high-probability inflection point.
Price action analysis reveals Bitcoin is currently trading at $88,641, representing a 1.39% gain over the past 24 hours as it tests the descending trendline established from the October high. The Relative Strength Index (RSI) on daily timeframes shows readings in the mid-50s, indicating neither overbought nor oversold conditions and leaving room for momentum accumulation. Key moving averages provide additional context: the 50-day Exponential Moving Average (EMA) at approximately $86,200 offers immediate support, while the 200-day Simple Moving Average (SMA) at $82,500 represents a more significant structural level.
Volume Profile analysis indicates the highest trading concentration between $85,000 and $90,000, creating what technical traders identify as a Value Area that will likely determine short-term direction. A successful break above the downtrend line, currently around $89,500, would invalidate the bearish structure established since October and target the $95,000 resistance level identified by analysts. Market structure suggests the $100,000 psychological barrier represents the next significant Fibonacci extension level at 1.618 of the recent correction wave.
Bullish Invalidation Level: A close below the 200-day SMA at $82,500 would invalidate the breakout thesis and suggest continuation of the broader downtrend.
Bearish Invalidation Level: A sustained break above $92,000 with follow-through volume would invalidate the bearish scenario and confirm trend reversal.
| Metric | Value |
|---|---|
| Current Bitcoin Price | $88,641 |
| 24-Hour Price Change | +1.39% |
| Options Approaching Expiry | $24 billion |
| Crypto Fear & Greed Index | 20/100 (Extreme Fear) |
| Market Capitalization Rank | #1 |
For institutional investors, this technical setup represents what quantitative analysts describe as a high-conviction entry opportunity with clearly defined risk parameters. The convergence of options expiry reducing hedging pressure and technical breakout testing creates what derivatives desks refer to as a Liquidity Grab scenario—where suppressed volatility suddenly expands as positioning unwinds. According to historical patterns from the Federal Reserve's monetary policy cycles, Bitcoin has typically experienced significant rallies approximately 12-18 months after major tightening cycles conclude, suggesting the current consolidation may represent the final accumulation phase before the next macro advance.
For retail traders, the clear technical levels provide defined risk management parameters uncommon in cryptocurrency markets. The extreme fear sentiment, while psychologically challenging, historically correlates with favorable risk-reward setups when combined with improving technical structure. Market structure suggests that successful breaks above well-established downtrend lines often trigger algorithmic buying from systematic funds, creating momentum that can persist for multiple weeks.
Industry commentary reflects cautious optimism tempered by technical discipline. "The crypto market remains undervalued and could reach new all-time highs in the coming months," noted crypto analyst Michaël van de Poppe, emphasizing the macro perspective. Technical accounts on X are focusing on the clean break-or-reject scenario at the downtrend line, with many highlighting the $95,000 target as the minimum measured move if resistance gives way. Derivatives traders are particularly focused on the options expiry, with several noting that reduced gamma exposure could allow for more efficient price discovery in the spot market.
Bullish Case: A successful break above the downtrend resistance with sustained volume targets initial resistance at $95,000, representing approximately 7% upside from current levels. Continued momentum through this level would likely test the psychological $100,000 barrier, with potential extension toward $110,000 based on Fibonacci projections. This scenario assumes the options expiry reduces dealer hedging sufficiently to allow clean price appreciation, similar to the January 2021 options roll-off that preceded Bitcoin's rally from $30,000 to $64,000.
Bearish Case: Rejection at the downtrend line followed by a break below the 200-day SMA at $82,500 would confirm continuation of the October downtrend. This would target the next significant support cluster between $78,000 and $80,000, representing a 10-12% decline from current levels. The bearish scenario becomes more probable if the options expiry creates additional volatility that fails to establish higher highs, creating what technical analysts describe as a Fair Value Gap (FVG) that needs filling at lower levels.
What is the significance of the $24 billion Bitcoin options expiry?Large options expiries can reduce dealer hedging activity in the spot market, potentially allowing for cleaner price discovery with less gamma-related suppression.
How does the current technical setup compare to historical patterns?Market structure shows similarities to the 2021 consolidation before Bitcoin's final advance to its all-time high, with price compressing against a descending trendline amid accumulation signals.
What technical indicators are most relevant for this breakout attempt?The downtrend line from October highs, volume profile between $85,000-$90,000, and the 200-day SMA at $82,500 provide the key framework for this setup.
Why is extreme fear sentiment potentially bullish for Bitcoin?Historical data indicates that periods of extreme fear often coincide with local bottoms and favorable risk-reward setups when combined with improving technical structure.
What time horizon should traders consider for this technical setup?The breakout or rejection decision will likely occur within 3-5 trading days, with sustained direction established by early January 2026 based on options expiry impact and follow-through volume.
Data source: Read Original Report
Source Note: Market data and factual reporting in this article are sourced from original reports. Commentary and analysis provided by CoinMarketBuzz.

Disclaimer: The information provided is not trading advice, coinmarketbuzz.com holds no liability for any investments made based on the information provided on this page. We strongly recommend independent research and/or consultation with a qualified professional before making any investment decisions.
coinmarketbuzz.com leverages advanced AI technology to analyze market data. All content is fact-checked and reviewed by our editorial team to ensure accuracy and neutrality.