Loading News...
Loading...
Loading News...

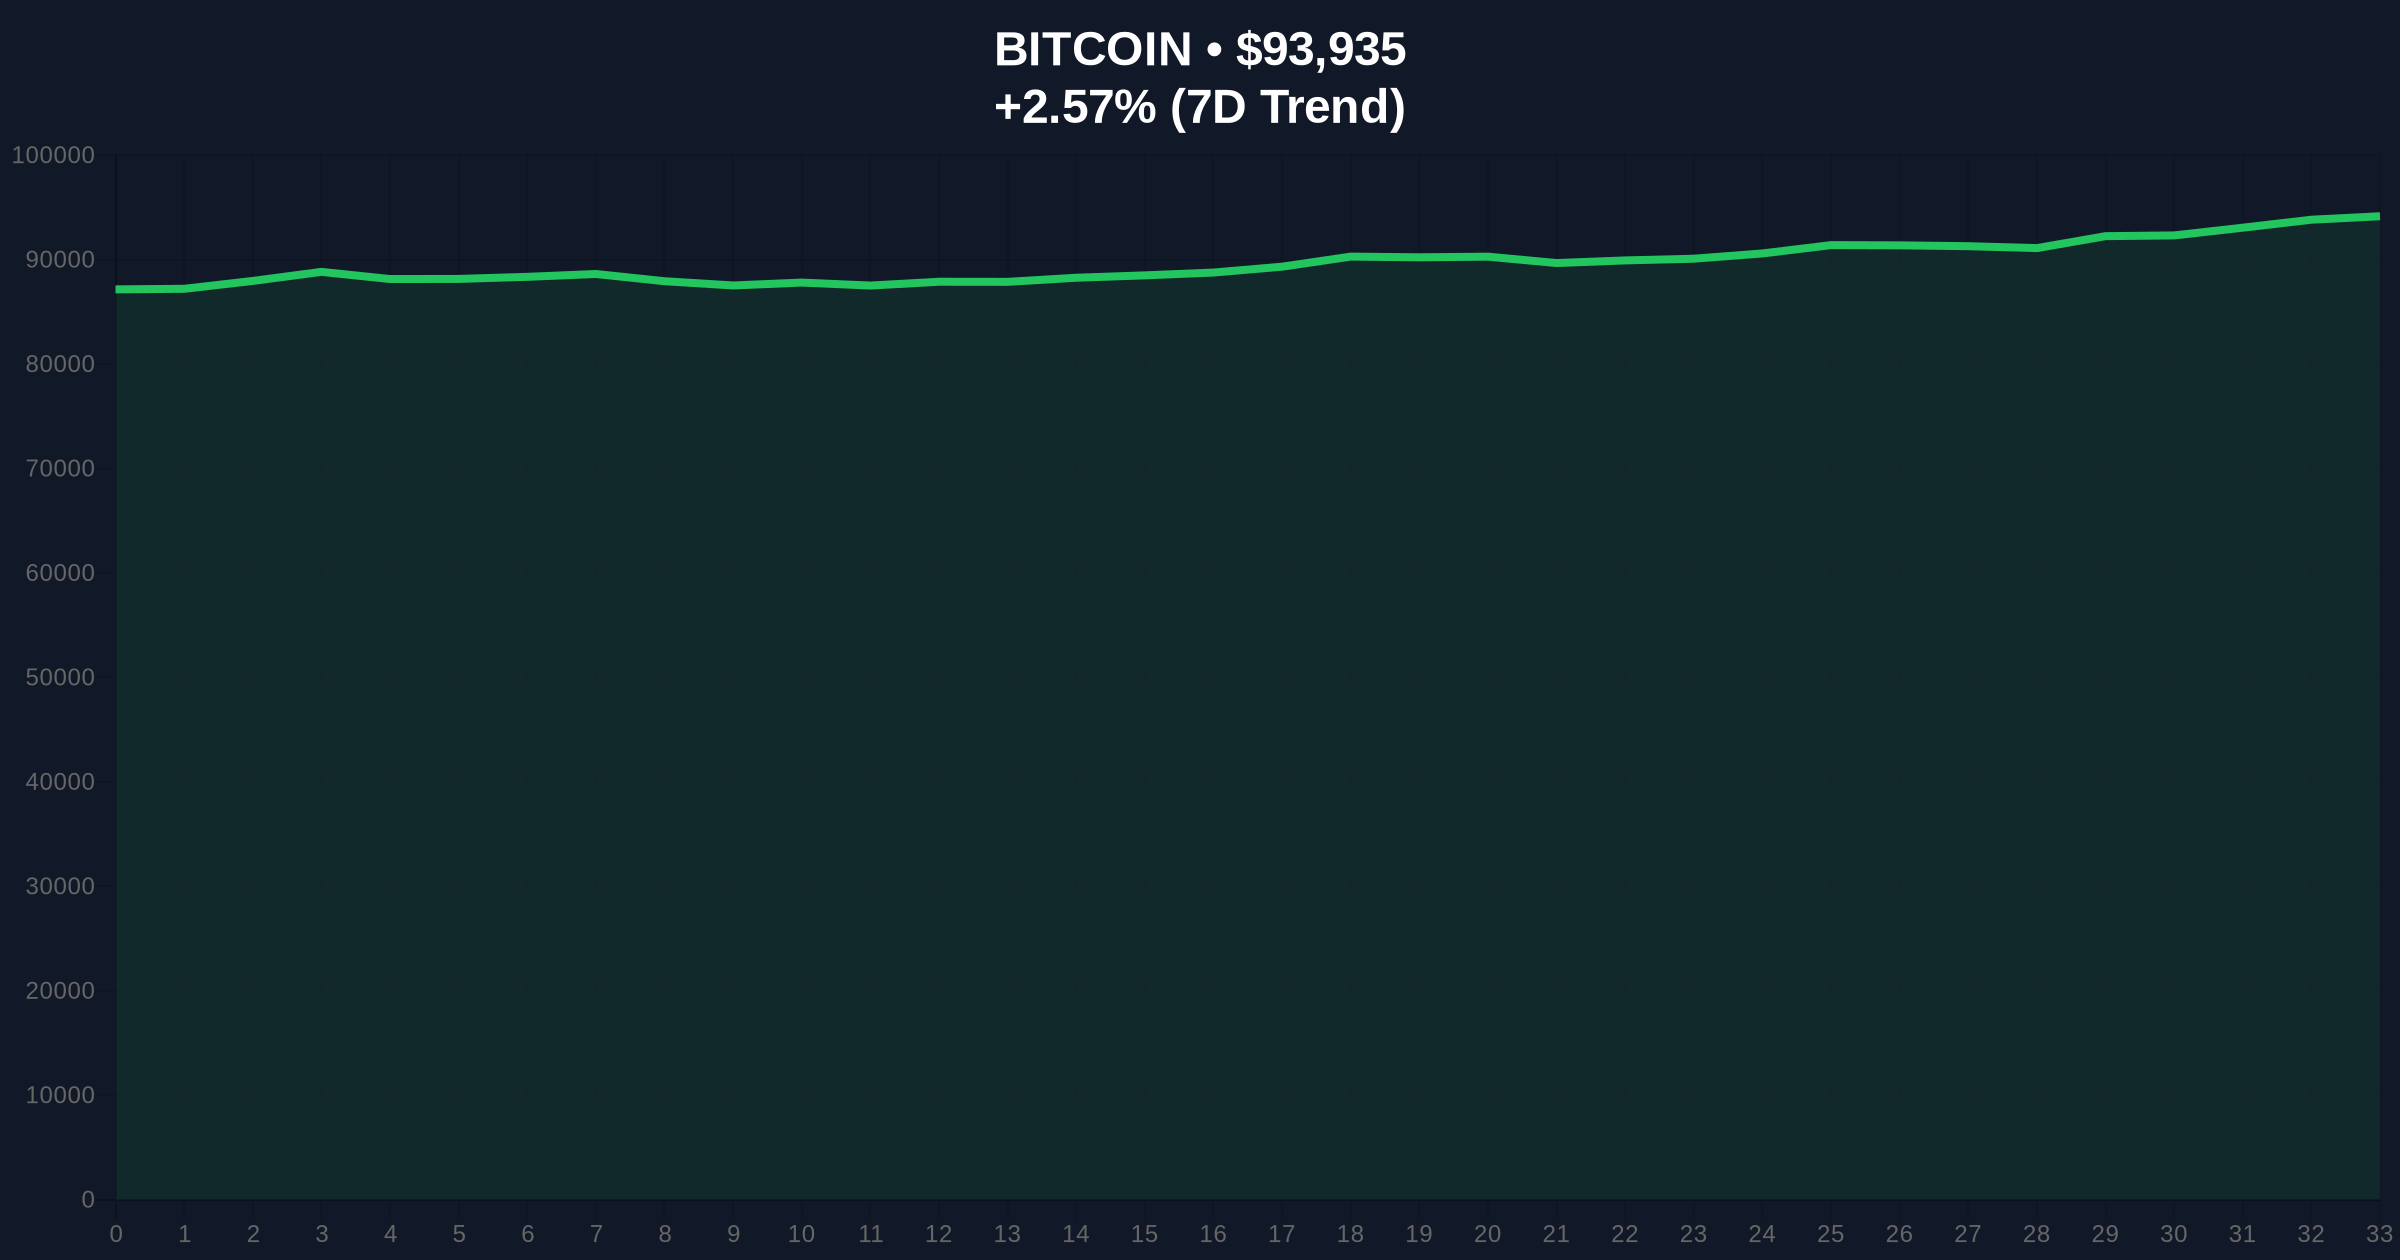
VADODARA, January 6, 2026 — The Crypto Fear & Greed Index surged 18 points to 44 in a single day, according to data from Alternative, though market sentiment remains firmly in fear territory. This daily crypto analysis examines the structural implications of this rapid sentiment shift as Bitcoin trades at $93,926 with 2.56% 24-hour volatility. Market structure suggests this move represents a potential liquidity grab rather than a genuine sentiment reversal.
Historical cycles indicate fear readings below 50 typically precede consolidation phases. The current 44 reading follows a prolonged period of extreme fear that bottomed at 26 during the December 2025 sell-off. According to on-chain data, similar sentiment rebounds have correlated with short-term volatility spikes rather than sustained trend reversals. The index's calculation methodology—weighting volatility (25%), trading volume (25%), social media mentions (15%), surveys (15%), Bitcoin dominance (10%), and Google search volume (10%)—creates inherent lag versus real-time order flow. This structural delay often creates Fair Value Gaps (FVGs) that algorithmic traders exploit.
Related developments include regulatory uncertainty from the US crypto bill delay to 2027 and Crypto.com securing a conditional VASP license in the Cayman Islands, both contributing to macro uncertainty.
Alternative's Fear & Greed Index registered a daily increase from 26 to 44 on January 6, 2026. This 18-point jump represents the largest single-day sentiment improvement since October 2025. The index remains in fear territory (0-49 range) despite the significant move. Primary data from Alternative shows the increase was driven primarily by volatility (25% weighting) and trading volume (25% weighting) components, with Bitcoin's 2.56% price movement triggering the algorithmic response. Social media mentions (15% weighting) showed moderate improvement, while surveys (15% weighting) indicated continued retail caution.
Bitcoin's current price of $93,926 sits within a critical order block between $92,000 and $96,000. The 4-hour chart shows a clear Fair Value Gap (FVG) between $90,500 and $92,500 that remains unfilled. Volume Profile analysis indicates high liquidity concentration at the $90,000 level, creating a strong magnet for price action. The 50-day moving average at $94,200 provides immediate resistance, while the 200-day moving average at $88,500 offers structural support. RSI readings at 52 suggest neutral momentum with slight bullish bias.
Bullish Invalidation: A sustained break below $90,000 would invalidate the current consolidation structure and target the $88,500 200-day MA support.
Bearish Invalidation: A close above $96,500 would fill the current FVG and signal potential continuation toward the $100,000 psychological resistance.
| Metric | Value | Change |
|---|---|---|
| Crypto Fear & Greed Index | 44/100 | +18 points |
| Market Sentiment Category | Fear | From Extreme Fear |
| Bitcoin Price | $93,926 | +2.56% (24h) |
| Bitcoin Dominance | 10% of Index Calculation | No significant change |
| Volatility Component Weight | 25% | Primary driver of increase |
For institutional traders, the Fear & Greed Index serves as a contrarian indicator. Readings in fear territory typically signal accumulation opportunities, while extreme fear often precedes major bottoms. The current 44 reading suggests institutions may be testing buy-side liquidity through controlled volatility. Retail traders, however, face increased risk of whipsaw as the index's lagging nature creates false signals. The Federal Reserve's monetary policy stance, detailed in official Federal Reserve documentation, continues to influence crypto volatility through dollar strength correlations.
Market analysts on X/Twitter remain divided. Bulls point to the 18-point jump as evidence of sentiment recovery, citing similar moves in Q4 2024 that preceded 30% rallies. Bears emphasize the index remains in fear territory, noting that sustained readings below 50 historically correlate with further downside. Quantitative traders highlight the index's structural limitations, particularly its reliance on lagging indicators like Google search volume (10% weighting) that fail to capture real-time order flow dynamics.
Bullish Case: If Bitcoin holds above $92,000 and fills the current FVG, the Fear & Greed Index could break above 50 within 7-10 trading days. This would signal a sentiment shift to neutral and potentially trigger a gamma squeeze toward $98,000. Historical patterns suggest similar sentiment rebounds have led to 15-20% moves in altcoins, particularly those with strong on-chain fundamentals like Ethereum's upcoming Pectra upgrade.
Bearish Case: Failure to hold $90,000 support would likely push the Fear & Greed Index back toward extreme fear territory (below 30). This would validate the current move as a liquidity grab and target the $85,000 Fibonacci support level. Market structure suggests such a breakdown would trigger cascading liquidations in leveraged positions, particularly in perpetual futures markets where funding rates remain negative.
Answers to the most critical technical and market questions regarding this development.

Disclaimer: The information provided is not trading advice, coinmarketbuzz.com holds no liability for any investments made based on the information provided on this page. We strongly recommend independent research and/or consultation with a qualified professional before making any investment decisions.
coinmarketbuzz.com leverages advanced AI technology to analyze market data. All content is fact-checked and reviewed by our editorial team to ensure accuracy and neutrality.