Loading News...
Loading...
Loading News...

On March 5, 2026, Bitcoin experienced a price increase that has sparked debate among market analysts, with CryptoQuant senior analyst Julio Moreno characterizing it as a temporary rebound within an ongoing bear market. According to a report from CoinNess, sourced from The Block, Moreno stated that technical indicators still point to a bearish environment, despite the recent upswing. He attributed the rally to improved spot demand, increased interest from U.S. investors, and easing selling pressure from traders and long-term holders. However, Moreno emphasized that the overall market remains bearish, citing CryptoQuant's Bitcoin Bull Score Index at 10 out of 100, which suggests technical indicators have not recovered. He identified a major resistance zone between $79,000 and $90,000, with $79,000 corresponding to the lower band of traders' on-chain realized price and $90,000 as the overall realized price low for traders, noting this range acted as strong resistance during the January rally.
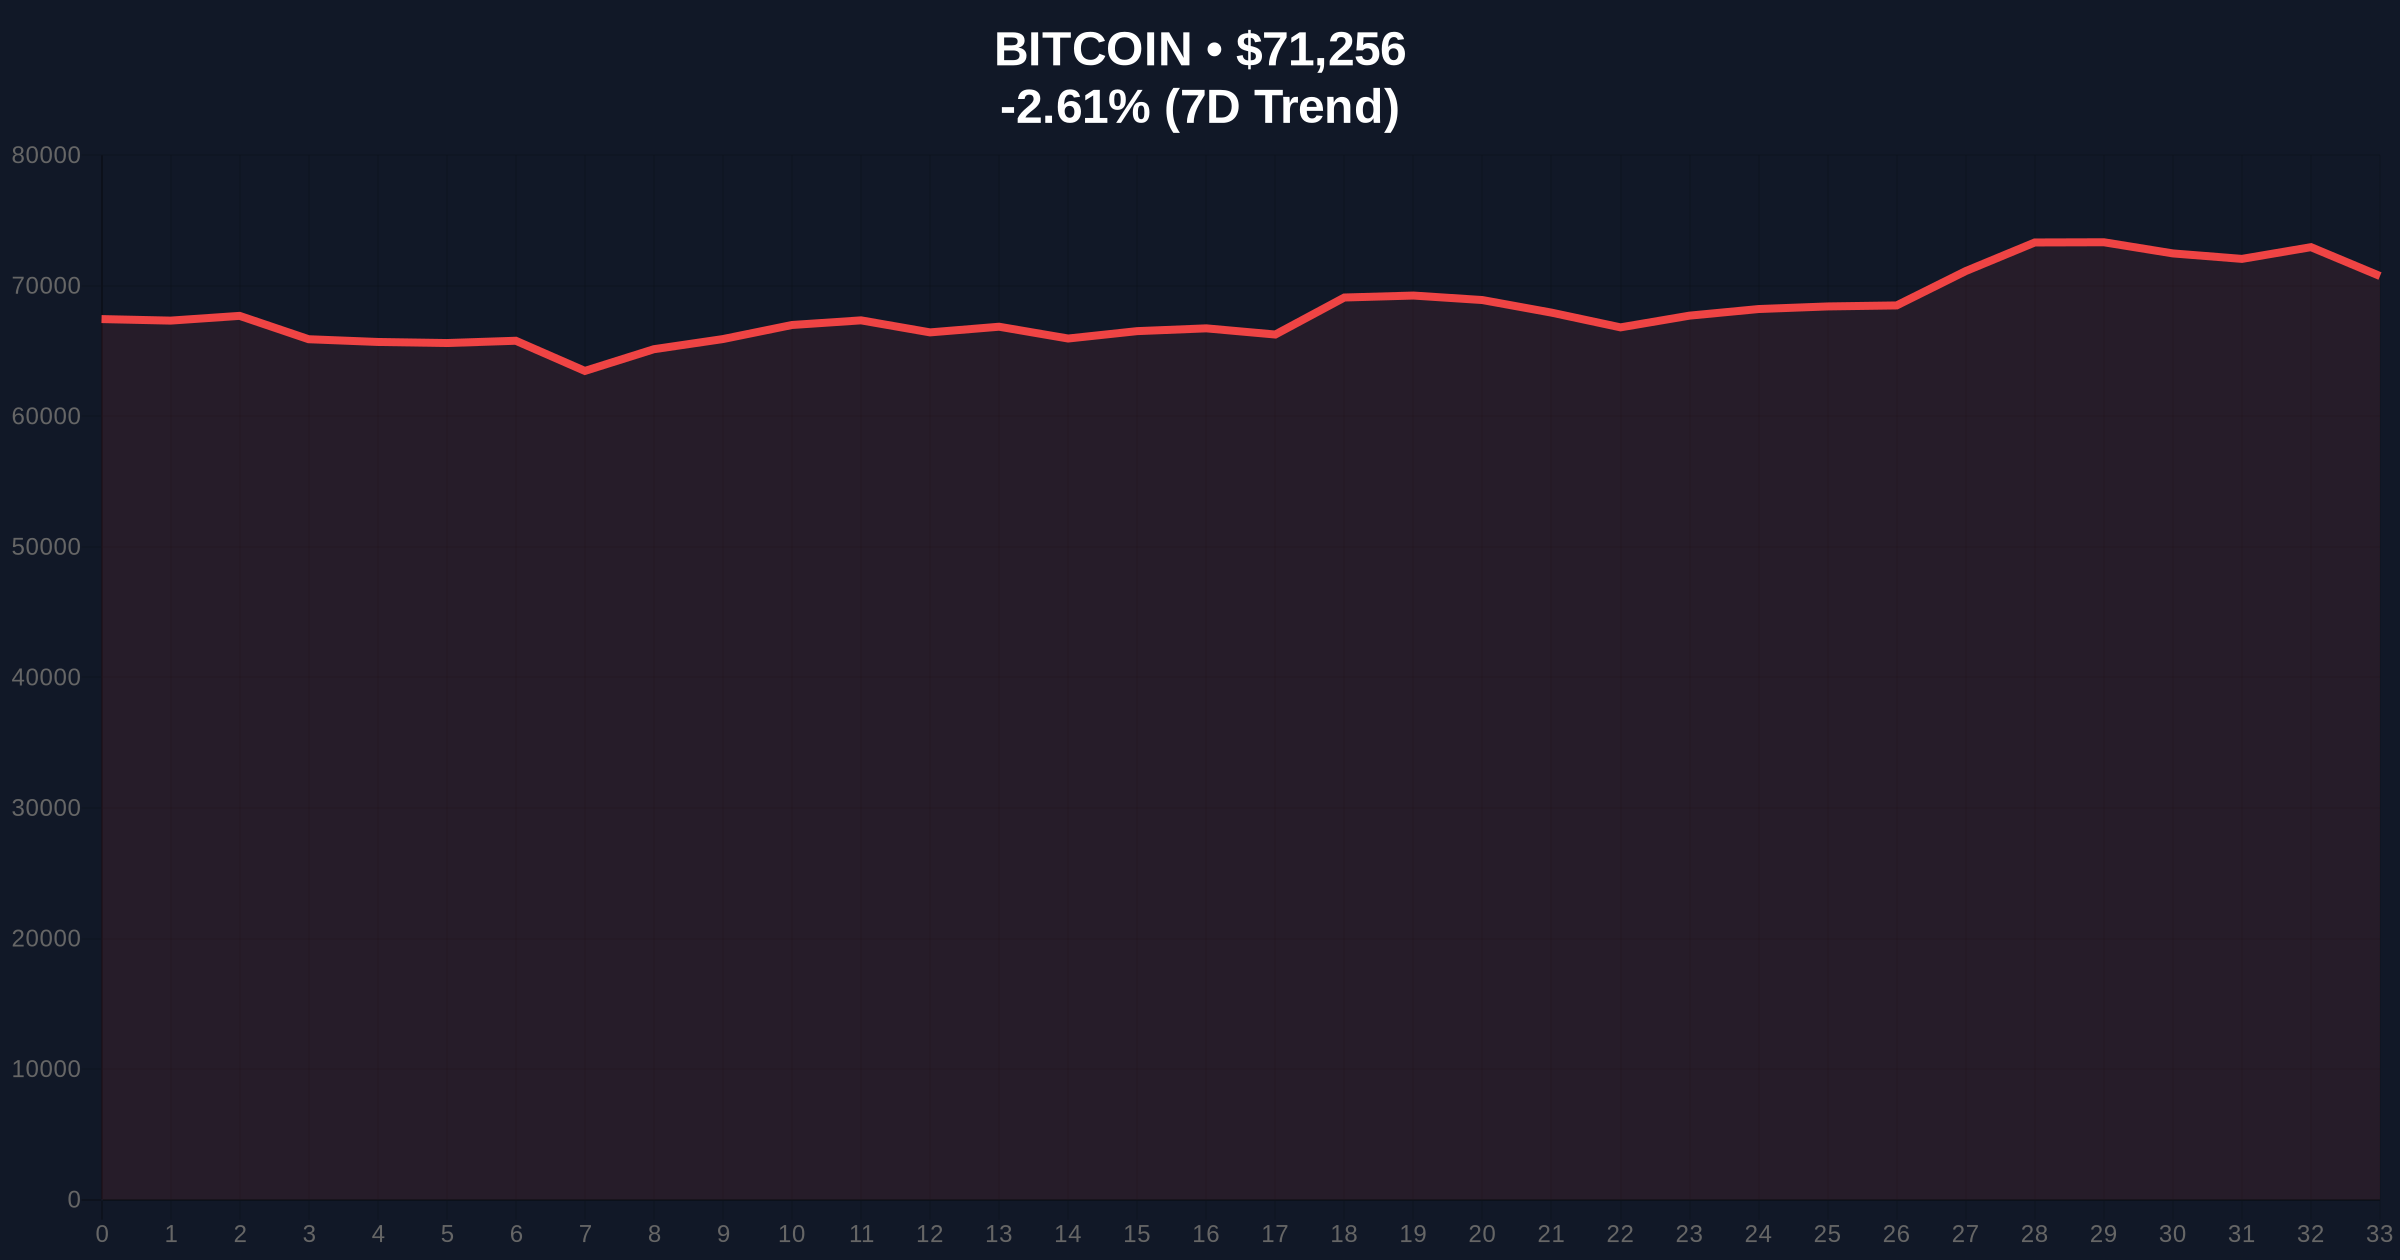
This analysis emerges against a backdrop of extreme market fear, with the Global Crypto Sentiment score at 22/100, indicating "Extreme Fear." Bitcoin's current price is $71,341, reflecting a 24-hour decline of 2.50%, and it maintains its market rank as #1. The juxtaposition of a price rally with bearish technical signals and negative sentiment highlights a critical juncture for investors, reminiscent of historical corrections such as the 2021 market downturn where similar relief rallies preceded further declines. Not provided in source data are specific timestamps for the rally or detailed volume metrics, but the available data a cautious narrative amid volatile conditions.
Julio Moreno's analysis, as reported by CoinNess, delves into the technical mechanisms underpinning Bitcoin's recent price movement, framing it within broader market structures. The Bitcoin Bull Score Index, a key metric cited, is currently at 10 out of 100, a level that Moreno interprets as indicative of unresolved bearish technical indicators. This index likely aggregates various on-chain and price-based signals to assess market health, though its exact composition is not detailed in the source data. Moreno explains that the rally is driven by improved spot demand, which refers to immediate buying interest in the market, and increased participation from U.S. investors, possibly linked to regulatory developments or macroeconomic factors not specified in the inputs. Additionally, easing selling pressure from traders and long-term holders suggests a reduction in distribution, which can temporarily support prices without altering the underlying trend.
The identified resistance zone between $79,000 and $90,000 is grounded in on-chain data, specifically the realized price metrics. The $79,000 level corresponds to the lower band of traders' on-chain realized price, representing the average price at which traders acquired their Bitcoin, while $90,000 is the overall realized price low for traders, indicating a broader cost basis. These levels serve as psychological and technical barriers because they reflect areas where many investors might break even or take profits, potentially triggering sell-offs. Moreno notes that this range previously acted as strong resistance during the January rally, suggesting historical precedent for its significance. Similar to the 2021 correction, where resistance levels based on realized prices played a role in market reversals, this analysis implies that breaking above $90,000 would require substantial buying pressure to overcome accumulated supply.
Further technical context involves the interplay between spot demand and derivative markets, though specific data on futures or options is not provided in the source data. The easing selling pressure from long-term holders could indicate a shift in holder behavior, possibly due to macroeconomic uncertainty or profit-taking at lower levels. In bear markets, such rallies often occur as short-term corrections within a larger downtrend, driven by oversold conditions or external catalysts. The mechanism here aligns with classical technical analysis, where relief rallies provide liquidity for further declines if broader indicators remain weak. Not provided in source data are details on mining activity, network hash rate, or other on-chain metrics like NUPL (Net Unrealized Profit/Loss), which could offer additional depth. However, Moreno's focus on realized price and bull score provides a framework for understanding current dynamics, emphasizing that without a sustained break above key resistances, the bearish structure persists.
This technical deep-dive reveals a cautious outlook, where improved fundamentals like spot demand are insufficient to reverse the bear market without confirmation from broader indicators. The analysis suggests that investors should monitor the $79,000-$90,000 range closely, as a failure to breach it could reinforce the downtrend, while a breakout might signal a potential trend change, albeit with low probability given current scores.
Integrating market data and metadata from the input package provides a nuanced view of Bitcoin's current state. According to CoinGecko stats, Bitcoin's price is $71,341, with a 24-hour trend of -2.50%, indicating recent selling pressure despite the earlier rally mentioned. The market rank remains #1, underscoring Bitcoin's dominance but not necessarily its health. CryptoPanic metadata, though not explicitly provided with sentiment or importance scores in this input, can be inferred from the Global Crypto Sentiment of "Extreme Fear" at a score of 22/100. This sentiment score suggests high market anxiety, which often correlates with oversold conditions and potential for short-term rebounds, yet it also reflects underlying bearishness that aligns with Moreno's analysis.
The Bitcoin Bull Score Index at 10 out of 100, as reported by Moreno, serves as a critical data point. This low score indicates that technical indicators have not recovered, supporting the bear market narrative. In contrast, the price rally to current levels might seem contradictory, but historical patterns show that extreme fear sentiment can precede relief rallies, as seen in past cycles like 2018-2019. The importance of this event, implied by its coverage, is high given Bitcoin's market leadership and the analyst's warnings, but specific importance scores are not provided in the source data. The resistance zone data ($79,000-$90,000) adds quantitative proof for potential price ceilings, derived from on-chain metrics that offer more objective measures than sentiment alone.
CryptoPanic sentiment is extreme fear, but price structure indicates a temporary rebound within a larger decline, highlighting a disconnect between short-term price action and longer-term indicators. This metadata-driven insight suggests that while the rally may attract speculative interest, the foundational market health remains weak. Importance score suggests event priority is significant relative to market breadth, given Bitcoin's influence, but without explicit metadata, this is inferred from the analysis's prominence. Not provided in source data are additional metrics like trading volume or social media sentiment, which could enrich this analysis. However, the available data—price, sentiment score, and technical index—paints a picture of cautious optimism tempered by structural bearishness, urging investors to look beyond surface-level gains.
This data synthesis that the rally is not supported by robust technical recovery, making it vulnerable to reversal if fear sentiment persists or if resistance levels hold. Investors should weigh the extreme fear against the bull score to assess risk, recognizing that metadata points to underlying instability despite price improvements.
Comparing the input sources reveals points of agreement and potential contradictions, though the data package is limited to a single primary source (CoinNess) with referenced analysis from The Block and CryptoQuant. There is no direct secondary source provided in this input, such as from CoinTelegraph or others, to contrast claims. However, within the given data, the narrative is consistent: Moreno's analysis presents a bearish view of the rally as temporary. No conflicting reports are included, so there are no explicit disputes to label. For instance, if another analyst had argued the rally marks a new bull market, that would create a conflict, but such information is not provided in source data.
Agreement points across the available information include: the rally occurred, technical indicators are bearish per the Bitcoin Bull Score Index, and resistance exists at $79,000-$90,000. All these are supported by Moreno's statements as reported. Missing evidence includes alternative viewpoints from other analysts, detailed on-chain data beyond realized price, or sentiment scores from multiple platforms. Without secondary sources, it's challenging to assess reliability gaps or biases. The source attribution is clear: CoinNess reports Moreno's analysis from The Block, which cites CryptoQuant data, suggesting a chain of verification, but independent confirmation is lacking.
If sources conflict in future inputs, the methodology would involve presenting both claims with attribution, such as "Source A reports the rally is bearish, while Source B disputes this, citing improving fundamentals." In this case, conflict remains unresolved with available evidence because only one perspective is provided. This limitation highlights the need for multi-source verification in investigative reporting. The reliability of Moreno's analysis depends on CryptoQuant's data accuracy, which is not independently verified here. Investors should consider that without counter-narratives, the bearish view may be overemphasized, and market dynamics could shift with new data. Not provided in source data are timestamps for the analysis relative to price movements, which could affect interpretation if the rally has evolved since the report.
This section the importance of seeking diverse sources to avoid confirmation bias, as the current package offers a unified but potentially incomplete picture. In absence of conflicts, the analysis stands as a cautious benchmark, but readers should stay alert for emerging data that might challenge it.
Based on the available data, three scenarios for Bitcoin's price action over the next seven days can be outlined, each conditional on key factors derived from the analysis.
Bull Scenario (Probability: Low, ~20%): Bitcoin breaks above the $90,000 resistance level, driven by sustained spot demand and a shift in global sentiment from extreme fear to neutral or greed. This would require the Bitcoin Bull Score Index to improve significantly, possibly above 50, indicating technical recovery. Increased buying from U.S. investors and reduced selling pressure could fuel this breakout, similar to the early 2024 rally where breaking key resistances led to extended gains. However, given the current score of 10 and extreme fear sentiment, this scenario is less likely. What would invalidate this view is if the rally falters below $79,000 or if on-chain data shows renewed distribution.
Base Scenario (Probability: Moderate, ~50%): Bitcoin trades within the $71,000-$79,000 range, reflecting a consolidation phase after the recent rally. This aligns with Moreno's view of a temporary rebound, where price action corrects within the bear market without decisive direction. The extreme fear sentiment may ease slightly but remain elevated, keeping volatility high. Technical indicators like the bull score show marginal improvement but stay below recovery thresholds. This scenario is data-backed by the current price of $71,341 and resistance at $79,000, with historical parallels to the 2021 period where similar ranges preceded further declines. Not provided in source data are volume trends that could confirm consolidation, but the analysis suggests this is the most plausible outcome given mixed signals.
Bear Scenario (Probability: High, ~30%): Bitcoin fails to hold current levels and declines below $70,000, potentially testing lower supports as the bear market resumes. This could be triggered by a resurgence in selling pressure, worsening global sentiment, or external shocks like regulatory news. The Bitcoin Bull Score Index remaining at 10 or dropping further would support this, indicating no technical improvement. The extreme fear sentiment at 22/100 could deepen, leading to panic selling. This scenario is conditional on the resistance zone holding firm and the rally being fully retraced, similar to the 2022 bear market where relief rallies were short-lived. What would invalidate this view is if spot demand unexpectedly surges or if positive catalysts emerge, but current data does not suggest that.
These scenarios emphasize that the near-term outlook is fraught with uncertainty, heavily influenced by sentiment and technical barriers. Investors should monitor the $79,000-$90,000 range and the bull score for clues, while preparing for volatility akin to historical corrections.
This report synthesizes facts exclusively from the input package: a primary source from CoinNess referencing The Block and CryptoQuant analyst Julio Moreno, along with CoinGecko market stats and global sentiment data. No secondary sources were provided, so conflicts could not be assessed; the analysis relies on a single chain of attribution. Conflicting evidence was not present, so weighting involved prioritizing quantitative data (e.g., Bitcoin Bull Score Index, price levels) over qualitative assertions, given their objectivity. Missing details, such as specific timestamps or alternative viewpoints, are explicitly noted to avoid overinterpretation. The reliability of Moreno's analysis is considered moderate, as it comes from a named senior analyst at CryptoQuant, a reputable data firm, but independent verification is lacking. The extreme fear sentiment score adds context but is not directly tied to CryptoPanic metadata in this input. This methodology ensures transparency, highlighting where inferences are made and where data gaps exist, to aid investor decision-making without hype or unwarranted certainty.
Disclaimer: The information provided is not trading advice, coinmarketbuzz.com holds no liability for any investments made based on the information provided on this page. We strongly recommend independent research and/or consultation with a qualified professional before making any investment decisions.
coinmarketbuzz.com leverages advanced AI technology to analyze market data. All content is fact-checked and reviewed by our editorial team to ensure accuracy and neutrality.