Loading News...
Loading...
Loading News...

VADODARA, April 17, 2026. The following report is based on currently available verified source material and market data.
Bitcoin's Key Moving Average Indicator Hasn't Triggered Yet, Suggesting Bear Market May Not Be Over developed into a market-moving story within the reported window. The initial source indicates immediate relevance for crypto sentiment, while fuller validation is still tied to cited datasets and official statements.
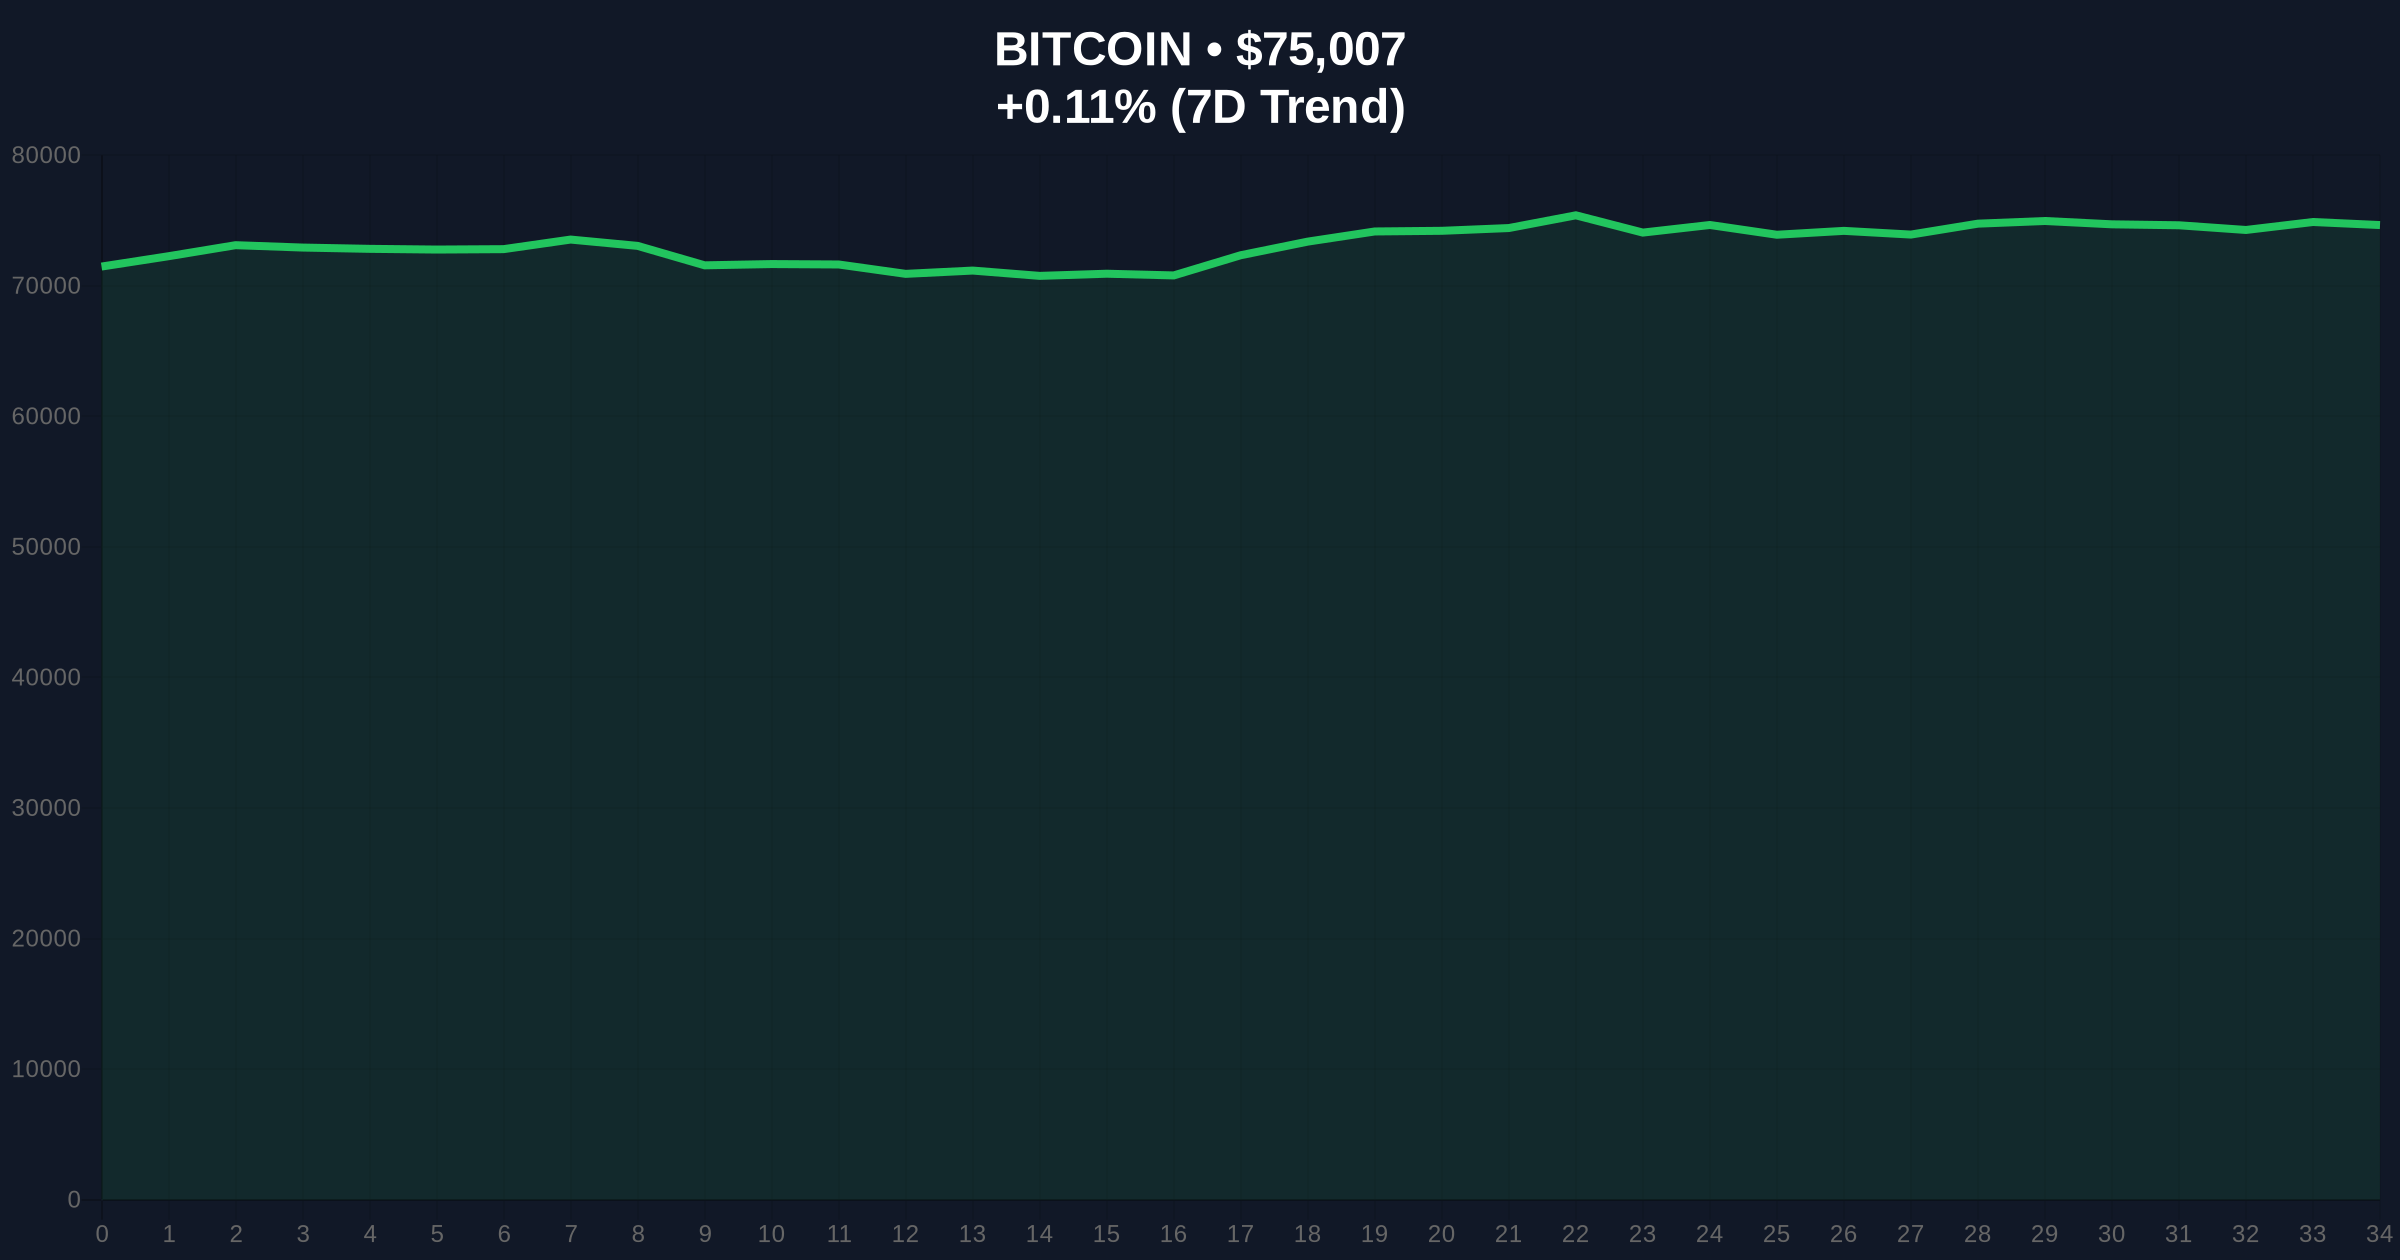
As of April 17, 2026, a simple technical indicator based on Bitcoin's 50- and 100-week moving averages, which has accurately marked every major bear market bottom since 2015, has not yet triggered. This suggests the broader bear market may still be intact, with Bitcoin's recent bounce to around $75,000 potentially being a temporary recovery rather than the start of a new bull run. The indicator's historical reliability adds weight to this cautious outlook, impacting trader sentiment and market analysis during a period of "Extreme Fear" in global crypto markets.
The key metric under scrutiny is the crossover of Bitcoin's 50-week moving average below its 100-week moving average, a signal that has coincided with three major bottoms in 2015, 2019, and 2022. As of the report date, this crossover has not occurred, with Bitcoin trading at $74,931.54 according to the source article, and real-time data showing $74,995 with a 0.08% 24-hour change. The global crypto sentiment score is 21/100, indicating "Extreme Fear." Bitcoin has declined from an October record high of over $126,000 to around $75,000, briefly reaching $60,000 in early February, but the 50-week average remains above the 100-week average.
| Metric | Value | Source |
|---|---|---|
| Bitcoin Price (Article) | $74,931.54 | Source: public statement |
| Bitcoin Price (Real-time) | $74,995 (0.08% 24h) | Source: CoinGecko |
| Global Crypto Sentiment | Extreme Fear (Score: 21/100) | Source: CoinGecko |
| Recent Bounce Range | $65,000 to $75,000 | Source: public statement |
| Record High (Oct 2025) | Over $126,000 | Source: public statement |
This development matters because it provides a data-driven counterpoint to bullish narratives amid market volatility. Why now? Bitcoin is trading significantly below its all-time high, with sentiment in "Extreme Fear," making timing a potential bottom critical for investors. Who benefits? Contrarian investors and long-term holders may see this as a signal to accumulate cautiously, while short-term traders could face heightened risk if the bear market persists. Time horizons: In the short term, the lack of a trigger suggests further downside or consolidation is possible; in the longer term, a future crossover could signal a major buying opportunity. Causal chain: The indicator's mechanism, based on moving average crossovers, reflects sustained selling pressure; its absence implies underlying bearish momentum hasn't fully exhausted, which could delay a sustainable recovery.
The indicator operates on a straightforward technical principle: it tracks the 50-week and 100-week simple moving averages of Bitcoin's price. When the 50-week average falls below the 100-week average, it signals a bearish crossover that has historically coincided with market bottoms. This occurs because prolonged selling drives prices down enough to drag the shorter-term average below the longer-term one, indicating peak fear and capitulation. Consequently, the crossover acts as a contrary indicator, marking potential turning points rather than predicting further declines. Underlying this trend, the averages smooth out daily noise, providing a clearer view of long-term trends, and their convergence without a crossover suggests selling pressure may not have reached extreme levels yet.
In comparison to other market developments, this indicator's signal contrasts with positive factors like institutional ETF inflows or regulatory advancements. For instance, while Bitcoin ETFs have drawn significant investment, technical indicators like this one highlight underlying market structure risks. Related developments in the crypto space include security vulnerabilities and regulatory shifts, but this analysis focuses purely on price action and historical patterns. Key adjacent factors to consider:
Relying solely on this indicator carries significant risks. Historical patterns do not guarantee future outcomes, and external factors like institutional adoption or macroeconomic shifts could override technical signals. The bearish scenario includes the possibility that the indicator fails to trigger or provides a false signal, leading to missed opportunities or losses. Key uncertainties and failure conditions:
Looking ahead, traders and investors should monitor the convergence of the 50- and 100-week averages for a potential crossover, which could signal a bottoming phase. In the near term, the absence of the trigger suggests caution is warranted, with potential for further price declines or sideways movement. If the crossover eventually occurs, it may present a strategic entry point for long-term positions, but diversification with other indicators is advisable to mitigate risk.
This indicator has a track record dating back to 2015, with crossovers in April 2015, February 2019, and September 2022 each marking major Bitcoin bottoms. For example, the 2015 crossover preceded a rally from $200 to nearly $20,000 by 2017, demonstrating its historical significance. The indicator's simplicity, relying only on moving averages, makes it accessible, but its reliability in past cycles adds weight to current analysis.
While this report focuses on technical analysis, broader crypto market context includes security incidents and regulatory news. For instance, recent hacks and exploits highlight ongoing vulnerabilities in the space, but these are not directly linked to the moving average indicator. Investors should consider such factors holistically when assessing market health.
In summary, Bitcoin's key moving average indicator has not yet triggered, suggesting the bear market may not be over and the recent price bounce could be temporary. While historical patterns provide a cautious outlook, risks remain due to evolving market dynamics. Traders should balance this technical signal with other data points for informed decision-making.
What to watch next: By Omkar Godbole|Edited by Shaurya Malwa Apr 17, 2026, 7:18 a.m.; CFTC's Selig says AI has helped make up for staffing cuts at key crypto watchdog 14 hours ago Cardano's Charles Hoskinson says Bitcoin's quantum fix is a hard fork that can't save Satoshi's coins 15 hours ago Crypto for Advisors: Tokenization’s evolution 16 hours ago Top Stories Wall Street trading-tech is coming to crypto as DoubleZero rolls out high-speed data for Solana 18 hours ago Buying coffee with bitcoin is easy, the resulting tax burden is not 22 hours ago Drift gets $148 million funding from Tether and partners as it replaces Circle stablecoin with USDT after massive exploit 18 hours ago Bitcoin funding rates hit most negative since 2023, history suggests bottom is in 20 hours ago Bitcoin devs bet a quantum attacker will play nice with a ‘wait and react’ plan Apr 16, 2026 The cheapest bitcoin ETF yet: Morgan Stanley uses 0.14% fee to draw $100 million in first week 21 hours ago In this article BTCBTC$74,931.54◢0.29% ### 📊 REAL-TIME MARKET INTELLIGENCE: - **Global Crypto Sentiment:** "Extreme Fear" (Score: 21/100)..
Evidence & Sources
Primary source: https://www.coindesk.com/markets/2026/04/17/this-simple-indicator-has-called-every-bottom-since-2015-it-hasn-t-triggered-yet
Updated at: Apr 17, 2026, 09:23 AM
Data window: Apr 17, 2026, 09:18 AM → Apr 17, 2026, 09:22 AM
Evidence stats: 9 metrics, 2 timeline points.
Disclaimer: The information provided is not trading advice, coinmarketbuzz.com holds no liability for any investments made based on the information provided on this page. We strongly recommend independent research and/or consultation with a qualified professional before making any investment decisions.
All published reports are reviewed by our editorial team for factual consistency, neutrality, and reader clarity.