Loading News...
Loading...
Loading News...

VADODARA, April 7, 2026. The following report is based on currently available verified source material and market data.
Bitcoin RSI Echoes 2022 Bear Market End, Signaling Potential Rebound Amid Extreme Fear developed into a market-moving story within the reported window. The initial source indicates immediate relevance for crypto sentiment, while fuller validation is still tied to cited datasets and official statements.
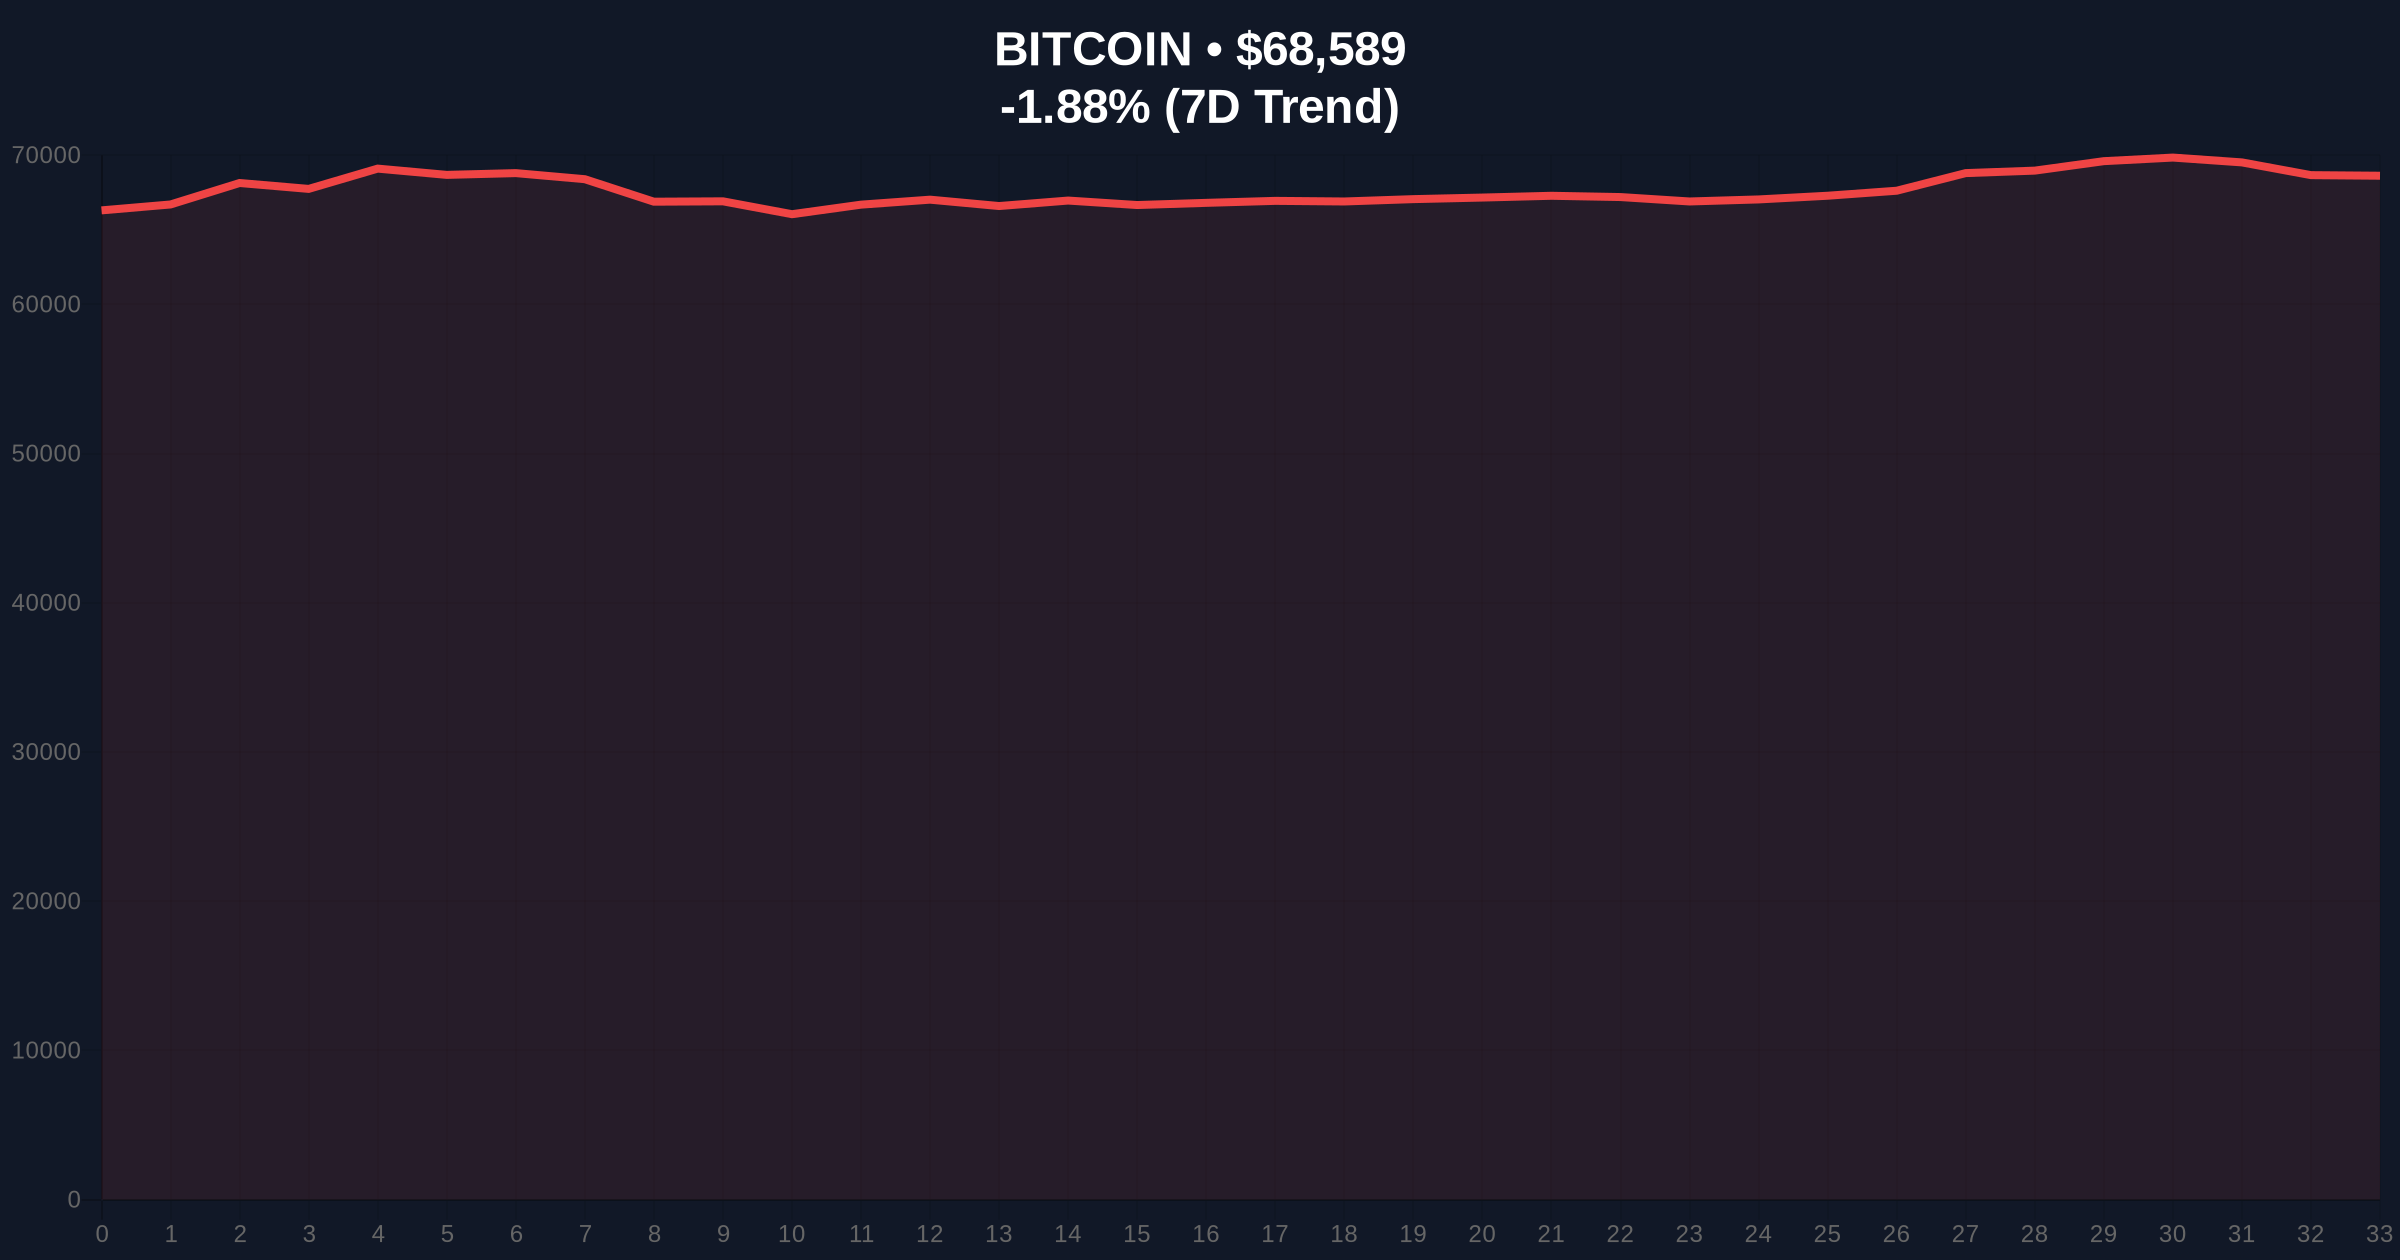
Bitcoin's stochastic RSI is "nearly perfectly" replicating patterns from the end of the 2022 bear market, according to analysis published on April 7, 2026. This technical signal suggests a potential repeat of the 2023 rebound, occurring as Bitcoin trades at $68,667 with a 24-hour decline of 1.77% amid "Extreme Fear" market sentiment. The comparison draws direct parallels between current price action and the historical bottom formation, raising questions about whether Bitcoin is setting up for another significant recovery phase.
The analysis centers on Bitcoin's stochastic RSI indicator, which shows a double-bottom pattern similar to early 2023. At that time, Bitcoin hit a multiyear low of $15,600, which ultimately marked the bear market bottom. Current market data shows Bitcoin at $68,667 with a 24-hour trend of -1.77%, while the global crypto sentiment score sits at 11/100, indicating "Extreme Fear." Source: CoinGecko. The stochastic RSI is attempting to clear its 50/100 midpoint after local lows in late January and late March 2026.
| Metric | Value | Source |
|---|---|---|
| Bitcoin Current Price | $68,667 | CoinGecko |
| 24-Hour Trend | -1.77% | CoinGecko |
| 2022 Bear Market Low | $15,600 | Public statement |
| Global Sentiment Score | 11/100 (Extreme Fear) | Market intelligence |
Why now? The timing is critical as Bitcoin faces bearish hurdles including potential bear-flag breakdowns on daily charts, making technical confirmation valuable for traders navigating uncertainty. Who benefits? Traders using RSI signals stand to gain if the pattern holds, while cautious investors may use this as a risk management tool. Time horizons: Short-term (weeks) focus on whether the stochastic RSI clears 50/100, while longer-term (months) implications hinge on weekly RSI developing a higher low. Causal chain: Stochastic RSI double bottom → indicator breaks above key level → reduced selling pressure → potential price support → momentum for recovery, mirroring the 2023 rebound mechanism.
Stochastic RSI is a derivative of traditional RSI, moving more quickly between oversold (below 30/100) and overbought (above 70/100) zones. The current pattern shows a double bottom with price, similar to early 2023, where the indicator's surge preceded Bitcoin's recovery. Mechanically, this suggests accumulation at lower levels followed by decreased sell-side liquidity, allowing momentum to build. The analysis notes that weekly standard RSI may also be forming a bullish divergence with price, adding another layer of confirmation if it develops over the coming weeks.
While Bitcoin shows these technical signals, other market segments face distinct challenges:
This contrast Bitcoin's relative resilience in technical structure compared to broader crypto assets.
The bullish narrative faces several risks:
Uncertainty remains around whether the pattern will fully develop, with analysts advising to watch for confirmation over the next few weeks.
If the stochastic RSI pattern holds, traders may see reduced volatility and a foundation for gradual recovery. However, failure to break above the 50/100 level could reinforce bearish trends, potentially testing lower support levels. Institutional flows from ETFs may interact with these technical signals, creating compounded effects on price discovery.
RSI indicators have long been used in crypto trading to identify overbought and oversold conditions. The 2022 bear market ended with Bitcoin at $15,600, followed by a significant rebound in 2023. Current analysis draws direct comparisons to that period, using stochastic RSI's sensitivity to detect early trend changes.
Recent market movements include Bitcoin ETF inflows hitting $471M, the highest since late February, amid ongoing volatility. Additionally, Bitcoin has shown decoupling from software stocks as geopolitical tensions and AI fears reshape correlations. These factors provide context for the technical analysis, suggesting broader market dynamics may influence RSI signals.
Bitcoin's stochastic RSI is mirroring the end of the 2022 bear market, offering a potential blueprint for recovery. While technical signals are promising, they operate within a context of extreme fear and bearish chart patterns that require careful monitoring.
What to watch next: Giving it a few more weeks to develop, given how the previous bottoms had… pic.twitter.com/nnT84R5Til, Jelle (@CryptoJelleNL) April 7, 2026 At the time, weekly RSI set its lowest level on record, one so far not matched in 2026, per data from TradingView.; exchange-level volume and liquidity data.
Evidence & Sources
Primary source: https://cointelegraph.com/markets/bitcoin-rsi-nearly-perfectly-copying-end-2022-bear-market-analysis
Updated at: Apr 07, 2026, 01:18 PM
Data window: Apr 07, 2026, 12:01 PM → Apr 07, 2026, 12:39 PM
Evidence stats: 3 metrics, 1 timeline points.
Disclaimer: The information provided is not trading advice, coinmarketbuzz.com holds no liability for any investments made based on the information provided on this page. We strongly recommend independent research and/or consultation with a qualified professional before making any investment decisions.
All published reports are reviewed by our editorial team for factual consistency, neutrality, and reader clarity.