Loading News...
Loading...
Loading News...

VADODARA, April 6, 2026. The following report is based on currently available verified source material and market data.
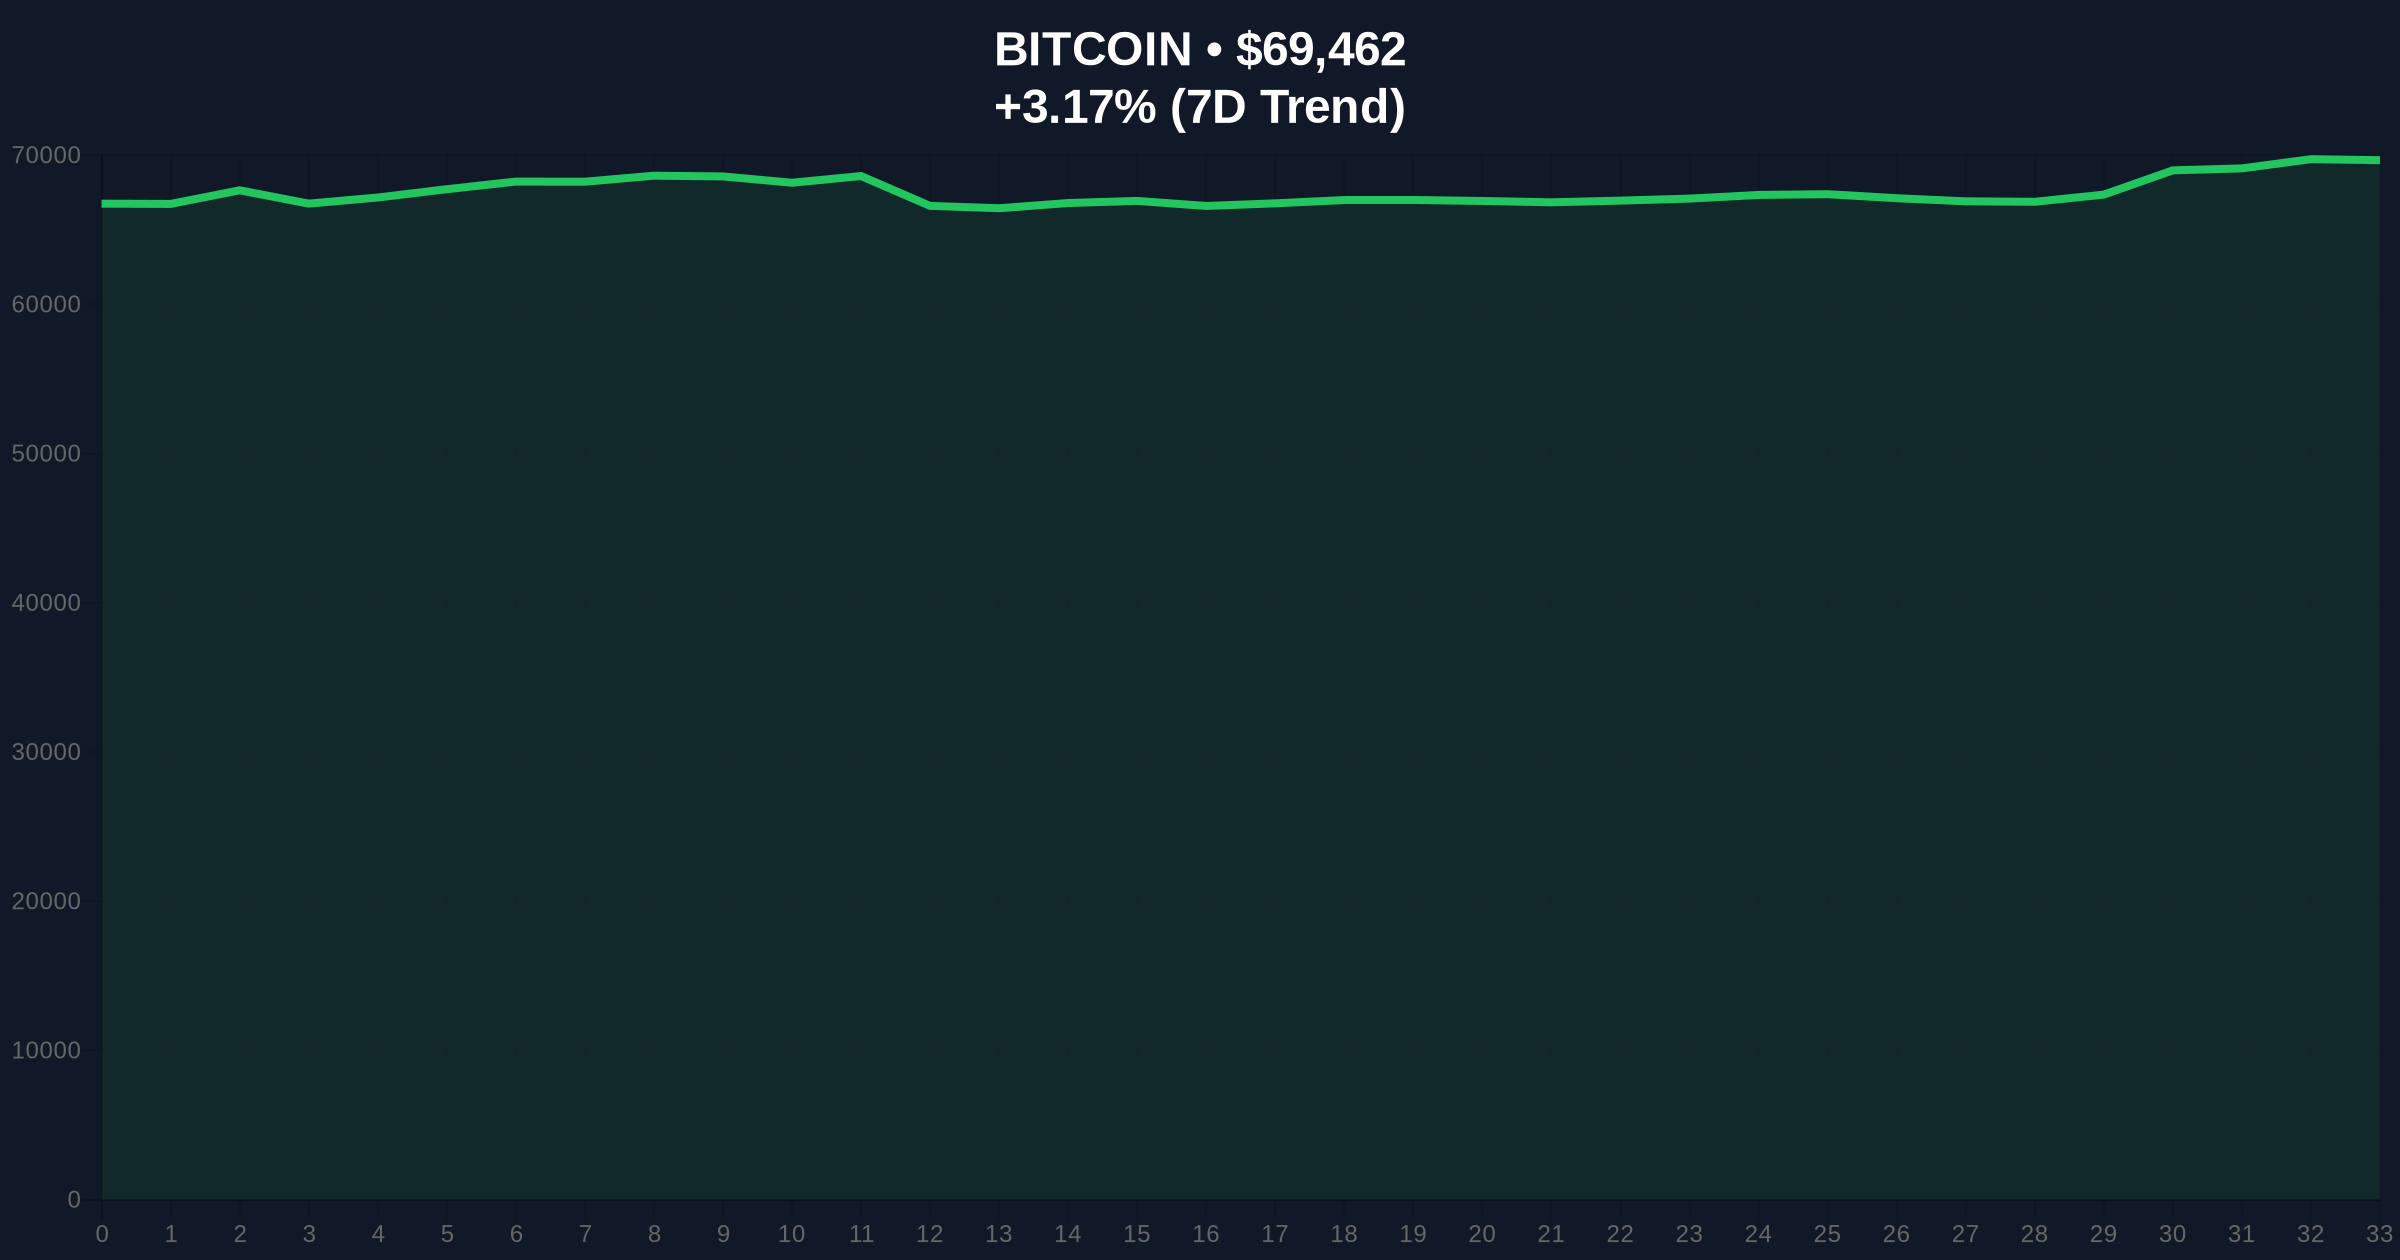
Bitcoin (BTC) faced renewed resistance below the $70,000 mark on Monday, April 6, 2026, as profit-taking activity and geopolitical uncertainty surrounding US-Iran tensions capped its upward momentum. The cryptocurrency, which briefly touched new April highs near $70,275, consolidated lower as on-chain data revealed significant realized profit spikes, signaling local exhaustion. This development matters because it highlights a recurring pattern of thin liquidity and selling pressure in the $70,000, $80,000 range, potentially delaying a breakout amid broader market nerves tied to geopolitical risks.
Concrete metrics from the event show Bitcoin's price action grappling with key psychological levels. According to TradingView data, BTC hit a high of $70,275 on Bitstamp before retreating. Source: public statement. Glassnode reported that realized profit per hour spiked above $20 million as price probed the $70,000 region, indicating profit-taking pressure. Source: blockchain analytics. Current market data from CoinGecko places Bitcoin at $69,463, with a 24-hour trend of 3.17% and a market rank of #1. Source: CoinGecko. The global crypto sentiment is "Extreme Fear" with a score of 13/100, reflecting heightened uncertainty.
| Metric | Value | Source |
|---|---|---|
| Bitcoin Price (Current) | $69,463 | CoinGecko |
| 24-Hour Trend | +3.17% | CoinGecko |
| April High | $70,275 | Public statement |
| Realized Profit/Hour Spike | Above $20M | Blockchain analytics |
| Global Sentiment Score | 13/100 (Extreme Fear) | Not provided in source data |
Why now? Bitcoin's approach to $70,000 coincides with heightened geopolitical tensions, as US President Donald Trump reiterated threats against Iran, creating market nerves that amplify profit-taking behavior. This timing is critical because it tests whether BTC can break through a resistance band that has capped rallies since February 2026. Who benefits? Short-term traders and profit-takers gain from selling at local highs, while long-term holders and bulls face delayed gains if the resistance holds. Time horizons: In the short term (days/weeks), price may consolidate or dip further if profit-taking persists; longer-term (months), a successful break above $71,000 could fuel a surge toward $80,000. Causal chain: Geopolitical uncertainty → increased market volatility → profit-taking by holders → thin sell-side liquidity → price capped below $70,000 → potential for breakout if buying pressure resumes.
The underlying mechanism involves on-chain metrics and market structure dynamics. As Bitcoin price approaches the $70,000, $80,000 band, realized profit per hour spikes, this occurs when holders sell coins at a profit, increasing selling pressure. Source: blockchain analytics. Thin liquidity in this range means that even moderate sell orders can absorb available bids, preventing upward momentum. This pattern, noted since February 2026, creates a feedback loop: each rally to this zone triggers profit-taking, which exhausts buying interest and caps the bounce. Additionally, trader behavior shows intra-week pivots, with Mondays and Thursdays often marking weekly highs and lows, adding to the mechanical pressure.
Bitcoin's struggle with profit-taking mirrors broader crypto market trends, where extreme fear sentiment and geopolitical risks impact asset performance. Similar to the 2021 correction, when BTC faced resistance at all-time highs amid macroeconomic uncertainty, current conditions show how external events can exacerbate internal market forces. In contrast, other sectors like AI and tokenized credit face different pressures, such as regulatory scrutiny or technological risks.
The bearish scenario hinges on several uncertainties. What would invalidate the bullish narrative? If profit-taking intensifies and geopolitical tensions escalate, BTC could break below support levels, leading to a deeper correction. Data gaps include exact volume metrics for the sell-off and detailed on-chain analysis of whale movements. What could be wrong about the analysis? The correlation between Trump's comments and market nerves might be overstated if other factors, like macroeconomic data, are driving sentiment. Failure condition: A sustained drop below key support (e.g., $65,000) would break the assumed mechanism of consolidation before a breakout.
Practically, traders should monitor price action around $71,000, as a break above this level could signal momentum toward $80,000, per analyst predictions. In the near term, increased volatility is likely, especially with Trump's deadline for an Iran deal on Tuesday. Market participants may adjust strategies based on intra-week pivot patterns, with Thursday potentially forming a weekly low if historical correlations hold.
Bitcoin has faced repeated resistance in the $70,000, $80,000 range since February 2026, with each approach met by profit-taking and thin liquidity. This historical context frames the current event as part of a broader consolidation phase, similar to past cycles where geopolitical or macroeconomic events amplified selling pressure at key levels.
Cross-market reactions include uncertain trading in US stocks at the Wall Street open, reflecting broader risk-off sentiment. Related articles highlight other crypto sectors facing challenges: for instance, amid extreme market fear, assets like Arbitrum and Polygon are undergoing price reassessments, while AI-powered cyberattacks and tokenized credit platforms present additional industry risks.
Bitcoin's inability to hold above $70,000 the interplay between profit-taking dynamics and geopolitical risks. With on-chain data signaling local exhaustion and sentiment in extreme fear, the path forward depends on whether buying pressure can overcome selling resistance, particularly around the $71,000 threshold.
What to watch next: Speaking to the media at a military event, US President Donald Trump reiterated earlier comments that Iran would “have no bridges” and “no power plants” unless a deal was reached.; “Watch price action closely today and tomorrow, it will confirm whether this intra-week pivot resolved as a high or a low.” BTC price chart..
Evidence & Sources
Primary source: https://cointelegraph.com/markets/bitcoin-profit-taking-keeps-btc-below-70k-trump-doubles-down-iran
Updated at: Apr 06, 2026, 07:48 PM
Data window: Apr 06, 2026, 06:03 PM → Apr 06, 2026, 07:47 PM
Evidence stats: 9 metrics, 2 timeline points.
Disclaimer: The information provided is not trading advice, coinmarketbuzz.com holds no liability for any investments made based on the information provided on this page. We strongly recommend independent research and/or consultation with a qualified professional before making any investment decisions.
All published reports are reviewed by our editorial team for factual consistency, neutrality, and reader clarity.