Loading News...
Loading...
Loading News...

VADODARA, April 6, 2026. The following report is based on currently available verified source material and market data.
Bitcoin Climbs Above $70,000 Amid Contrarian Bottoming Signals and Extreme Market Fear developed into a market-moving story within the reported window. The initial source indicates immediate relevance for crypto sentiment, while fuller validation is still tied to cited datasets and official statements.
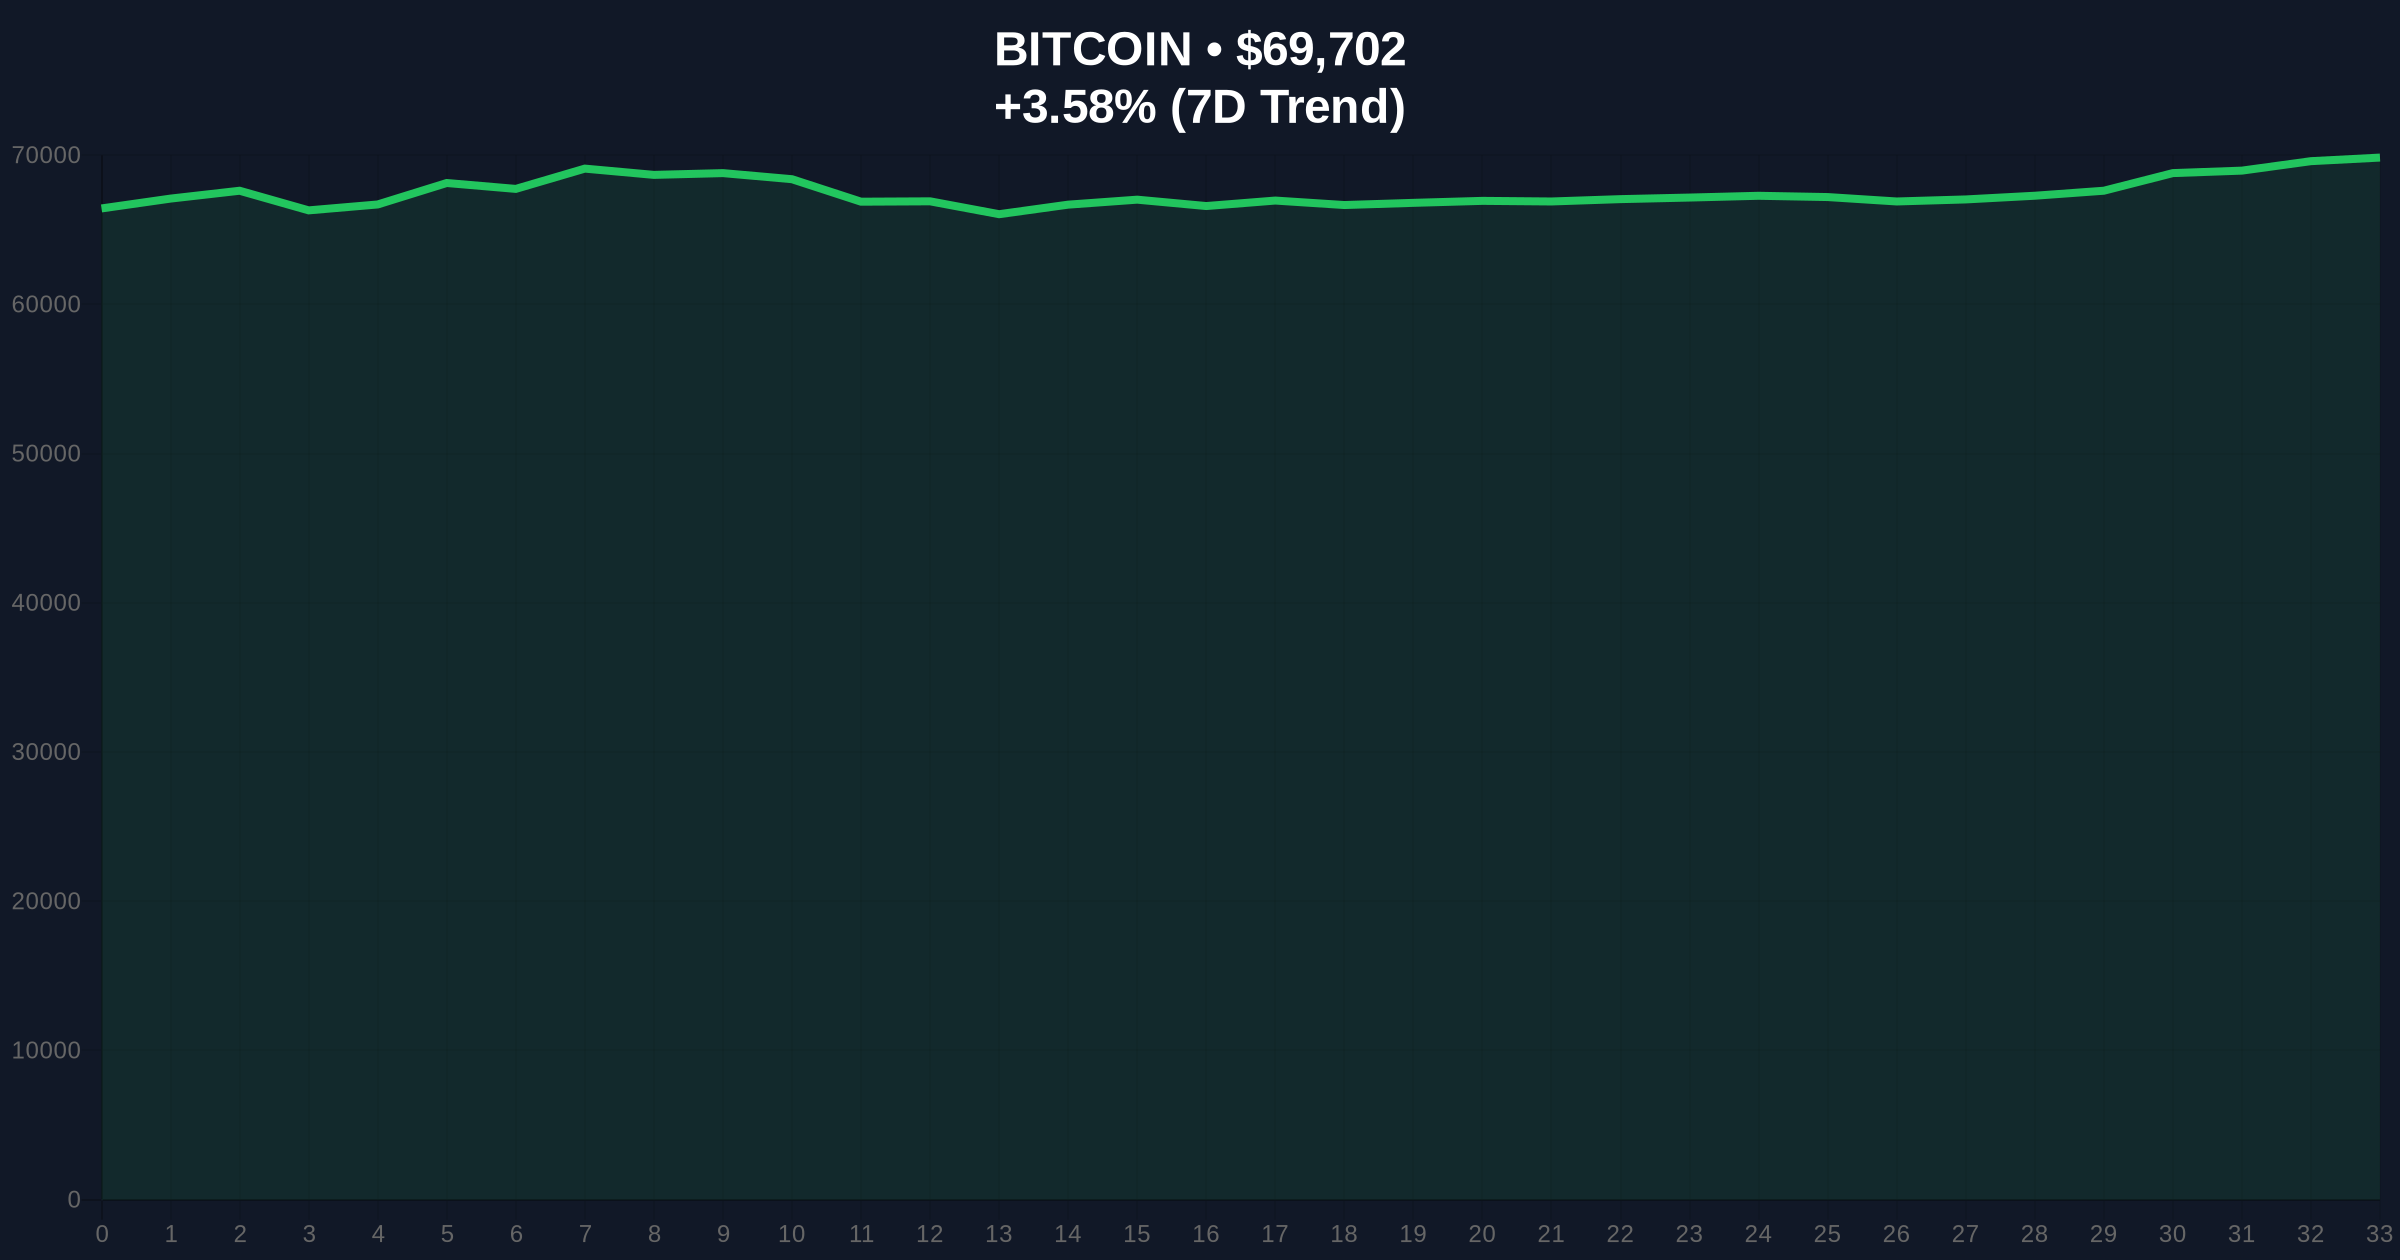
Bitcoin climbed above $70,000 during U.S. afternoon hours on Monday, April 6, 2026, marking a nearly 4% gain over the past 24 hours. The move occurred in quiet post-Easter trading and coincided with emerging contrarian buy signals, including executive exits at bitcoin treasury companies and bearish commentary from longtime bulls. This price action comes amid a backdrop of "Extreme Fear" in global crypto sentiment, with a score of 13/100, suggesting that while prices are rising, underlying market anxiety remains high. The significance lies in the potential formation of a market bottom after Bitcoin crashed to $60,000 in early February, offering hope to a battered crypto sector.
Key metrics from the event highlight Bitcoin's recent performance and market conditions. The price surge above $70,000 represents a recovery from earlier lows, with current data showing Bitcoin at $69,730, up 3.63% in the last 24 hours. Source: CoinGecko. Other major assets like ether, XRP, and solana posted similar gains, indicating broad-based momentum. In traditional markets, the Nasdaq advanced by 0.45% and the S&P 500 by 0.3%, reflecting a modest correlation during this period. Source: public statement. However, derivatives markets show growing downside risk, with options traders pricing a potential break below $68,000 due to weak demand and fragile positioning. Source: exchange data.
| Metric | Value | Source |
|---|---|---|
| Bitcoin Price (Current) | $69,730 | CoinGecko |
| 24-Hour Trend | 3.63% | CoinGecko |
| Global Crypto Sentiment | Extreme Fear (13/100) | Market Intelligence |
| Nasdaq Gain | 0.45% | Public Statement |
| Options Risk Level | Below $68,000 | Exchange Data |
This development matters due to four key factors. First, why now? The timing is critical as Bitcoin attempts to recover from a crash to $60,000 in early February, with contrarian signals emerging during a period of extreme market fear, suggesting potential bottom formation. Second, who benefits? Contrarian bulls and long-term investors stand to gain if a bottom is confirmed, while short-term traders face volatility from derivatives risks. Third, time horizons: In the short term (days/weeks), price stability above $70,000 could attract retail FOMO, but longer-term (months/years), sideways trading for 8-12 years, as suggested by analyst Willy Woo, may dampen bullish momentum. Fourth, causal chain: The mechanism involves whale selling (e.g., miners unloading Bitcoin) reducing supply pressure, combined with modest stock market gains creating a supportive environment, leading to price appreciation despite high fear metrics.
The underlying mechanics driving Bitcoin's move above $70,000 involve a combination of on-chain activity and market sentiment shifts. Initially, prominent holders like bitcoin miners MARA Holdings and Riot Platforms sold significant portions of their stacks, with MARA unloading over 15,000 Bitcoin and Riot selling its entire March production of 3,778 coins. This selling pressure, typically bearish, is interpreted contrarily as a potential capitulation signal, reducing liquid supply and setting the stage for a rebound. Concurrently, executive exits at bitcoin treasury companies, such as Jeff Park leaving ProCap Financial, signal distress in leveraged Bitcoin plays, which may flush out weak hands. The price climb above $70,000 mechanically results from reduced sell-side liquidity post-capitulation, allowing even modest buying to push prices higher, exacerbated by a negative gamma setup in options markets that could accelerate moves if $68,000 is breached.
Similar to the 2021 correction, where Bitcoin bottomed amid extreme fear before rallying, current conditions show parallels but with heightened institutional involvement. In adjacent developments:
Despite bullish signals, several risks could invalidate the bottoming narrative. First, the extreme fear sentiment score of 13/100 suggests underlying weakness; if fear escalates, it could trigger panic selling rather than stabilization. Second, options market data indicates traders are bracing for a sharp drop below $68,000, with a negative gamma setup potentially forcing market makers to sell more Bitcoin as prices fall, accelerating declines. Third, uncertainty remains about whether current signals truly mark a bottom, as historical comparisons show false bottoms can occur during prolonged bear markets. Key failure conditions include:
Practically, near-term implications include heightened volatility as Bitcoin tests resistance levels above $70,000. Traders should monitor options activity for gamma-related squeezes and on-chain metrics for continued whale behavior. If the bottom holds, it could pave the way for a gradual recovery, but sideways trading for years, as forecasted, may limit upside. Institutions may reassess Bitcoin treasury strategies given poor performance of related companies, potentially shifting towards direct holdings or ETFs.
Historically, Bitcoin has experienced cycles of sharp corrections followed by periods of consolidation, often marked by contrarian signals during extreme fear. The current situation echoes early 2023, when bottoming signs emerged after a crash, leading to a sustained rally. Structurally, the rise of bitcoin treasury companies in 2025 aimed to replicate Michael Saylor's success but has struggled, adding a new layer of market complexity.
Cross-market reactions include modest gains in major stock indices, suggesting some correlation, while other crypto news highlights ongoing sector challenges. For context, recent articles discuss profit-taking capping Bitcoin below $70K amid geopolitical tensions and Jamie Dimon's warnings about blockchain competitors, indicating broader industry shifts.
Bitcoin's climb above $70,000 amid contrarian bottoming signals presents a complex picture of recovery potential against a backdrop of extreme fear and derivatives risks. While whale selling and executive exits may indicate capitulation, supporting a bullish case, options market pricing and sentiment metrics caution against premature optimism. The key takeaway is that bottom formation requires confirmation through sustained price action and reduced volatility.
What to watch next: By Stephen Alpher Updated Apr 6, 2026, 6:33 p.m.; Published Apr 6, 2026, 6:28 p.m..
Evidence & Sources
Primary source: https://www.coindesk.com/markets/2026/04/06/bitcoin-climbs-above-usd70-000-as-more-contrarian-bottoming-signs-emerge
Updated at: Apr 06, 2026, 09:58 PM
Data window: Apr 06, 2026, 06:28 PM → Apr 06, 2026, 09:50 PM
Evidence stats: 9 metrics, 3 timeline points.
Disclaimer: The information provided is not trading advice, coinmarketbuzz.com holds no liability for any investments made based on the information provided on this page. We strongly recommend independent research and/or consultation with a qualified professional before making any investment decisions.
All published reports are reviewed by our editorial team for factual consistency, neutrality, and reader clarity.