Loading News...
Loading...
Loading News...

VADODARA, April 8, 2026. The following report is based on currently available verified source material and market data.
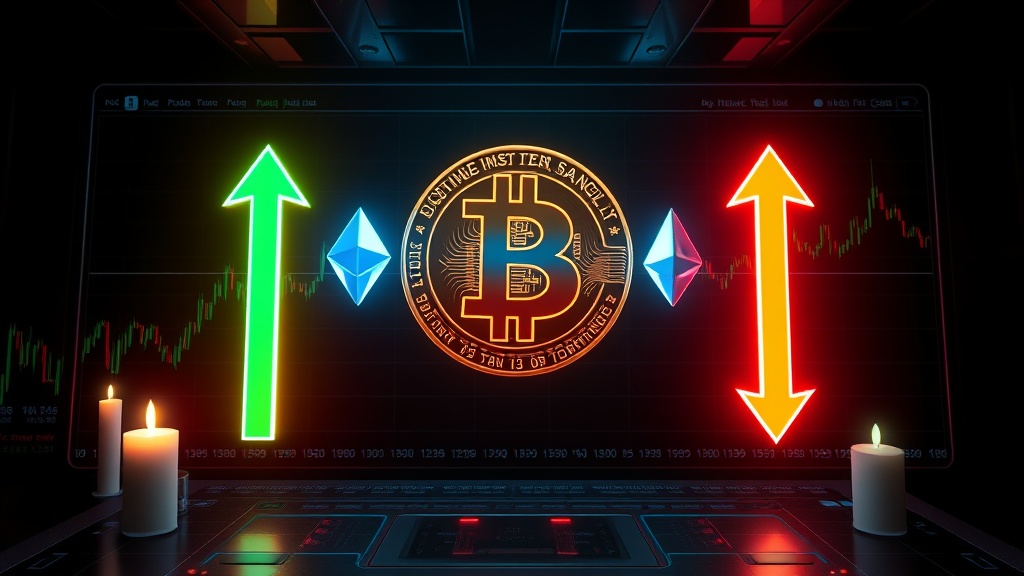
Bitcoin Buyers Accumulate 850,000 BTC Below $70,000: Dip Demand or Overleveraged Trap? developed into a market-moving story within the reported window. The initial source indicates immediate relevance for crypto sentiment, while fuller validation is still tied to cited datasets and official statements.
On April 8, 2026, blockchain analytics revealed Bitcoin buyers accumulated nearly 850,000 BTC in the $60,000 to $70,000 price range, signaling aggressive dip buying. This accumulation, representing a significant increase in supply concentration, comes as Bitcoin trades at $71,502 with a 4.07% 24-hour gain amid a "Extreme Fear" market sentiment. The development matters because it suggests potential price support below $70,000 but raises questions about market stability given high leveraged positions and geopolitical uncertainties.
Concrete metrics from on-chain data and market intelligence provide a snapshot of the accumulation activity. According to Glassnode's Realized Price Distribution (URPD) metric, the supply of Bitcoin last moved in the $60,000-$70,000 range increased by 844,275 BTC since January 1, 2026, reaching 1.85 million BTC. This range now holds approximately 9.23% of Bitcoin's circulating supply, with the $70,000 price band alone accounting for 2.2% of total supply. In contrast, the $70,000 to $80,000 range shows only 400,000 BTC, creating a supply "air gap." Current market data indicates Bitcoin is trading at $71,502, up 4.07% in 24 hours, while global crypto sentiment registers "Extreme Fear" with a score of 17/100. Source: blockchain analytics, Source: CoinGecko.
| Metric | Value | Source |
|---|---|---|
| BTC Accumulated ($60K-$70K) | ~850,000 BTC | Blockchain Analytics |
| Supply Increase Since Jan 1 | 844,275 BTC | Glassnode URPD |
| Current Bitcoin Price | $71,502 | CoinGecko |
| 24-Hour Price Trend | +4.07% | CoinGecko |
| Market Sentiment | Extreme Fear (17/100) | Not provided in source data |
Why now? This accumulation is significant as Bitcoin has spent much of the past five weeks trading below $70,000, recently rebounding above this level following a temporary U.S.-Iran ceasefire. The timing coincides with elevated leveraged long positions, hinting at underlying market uncertainty. Who benefits? Short-term, dip buyers and accumulation-focused investors may gain if prices stabilize or rise from this support zone. However, overleveraged traders risk liquidation if support fails. Time horizons: In the short-term (days/weeks), the concentrated supply could act as a floor, reducing selling pressure. Longer-term (months/years), it may indicate institutional or whale accumulation for holding, but if leveraged, it could precede a volatility spike. Causal chain: The mechanism involves dip buying below $70,000 → increased supply concentration in that range → reduced likelihood of sellers offloading below their cost basis → potential price support formation. However, this assumes rational holder behavior, which may not hold under stress.
The accumulation is tracked via Glassnode's Realized Price Distribution (URPD), an entity-adjusted metric that groups coins by the average acquisition price of their owner. It shows where Bitcoin UTXOs (unspent transaction outputs) were last moved on-chain. The increase to 1.85 million BTC in the $60,000-$70,000 range mechanically works by indicating that buyers actively transacted in this band, effectively "anchoring" coins at these prices. This creates a liquidity dynamic: with 9.23% of supply concentrated here, sell-side liquidity may thin out as holders resist selling at a loss, potentially forming a support floor. Conversely, the air gap to $80,000 suggests that if buying pressure resumes, prices could move rapidly upward due to limited supply resistance.
The bullish narrative of strong dip demand faces several skeptical counterpoints:
Practically, traders should watch the $70,000 level as a key battleground; holding above it could validate the accumulation as support, while a drop may test the $60,000 floor. The air gap to $80,000 suggests potential for quick rallies if buying resumes, but the thin supply also means volatility could spike. Institutions may view this as a buying opportunity for long-term holds, but retail traders should be wary of leverage risks given the high sentiment fear.
Bitcoin's price action has been choppy under $70,000 recently, but resilience compared to traditional risk assets like stocks highlights its perceived safe-haven attributes during events like the Iran conflict. The URPD metric has historically been used to identify supply concentrations that influence price behavior, making this accumulation a critical data point for market structure analysis.
Cross-market reactions include Bitcoin's rebound above $70,000 post-ceasefire, though the rally is described as cautious due to high leverage. Not provided in source data for direct altcoin or ETF impacts. Contextually, developments like Iran's exploration of crypto for oil tolls or banking crypto pushes may indirectly support accumulation narratives by increasing Bitcoin's utility and institutional adoption.
The accumulation of 850,000 BTC below $70,000 presents a dual narrative: strong dip demand could establish a price floor, but high leverage and extreme fear sentiment caution against over-optimism. Market participants must balance on-chain signals with broader risk factors.
Q1: What does the 850,000 BTC accumulation mean for Bitcoin's price?It suggests potential support in the $60,000-$70,000 range, as holders may be reluctant to sell below their cost basis, but high leverage risks could undermine this if liquidations occur.
Q2: How is this accumulation measured?Via Glassnode's Realized Price Distribution (URPD), an entity-adjusted metric tracking where Bitcoin UTXOs were last moved on-chain, grouping coins by owner acquisition price.
Q3: Why is there a supply air gap above $70,000?Only 400,000 BTC sits in the $70,000-$80,000 range, indicating less transaction activity, which could allow for rapid price moves if buying pressure increases.
Q4: What risks challenge the bullish accumulation narrative?Elevated leveraged long positions, extreme fear sentiment, and geopolitical uncertainties like U.S.-Iran tensions could trigger volatility or breakdowns below support.
Q5: How does this relate to market sentiment?Global crypto sentiment is "Extreme Fear" at 17/100, contrasting with the aggressive accumulation, hinting at potential market manipulation or divergent investor behaviors.
Q6: What should traders watch next?Key levels include holding above $70,000 for support validation and monitoring leverage metrics for signs of unwinding that could pressure prices.
Traders and analysts are closely watching the $70,000 level and leverage metrics to gauge whether this accumulation will hold as support or falter under selling pressure.
Evidence & Sources
Primary source: https://www.coindesk.com/markets/2026/04/08/bitcoin-buyers-gobbled-up-nearly-850-000-btc-between-usd60-000-and-usd70-000
Updated at: Apr 08, 2026, 09:03 PM
Data window: Apr 08, 2026, 01:36 PM → Apr 08, 2026, 08:35 PM
Evidence stats: 9 metrics, 3 timeline points.
Disclaimer: The information provided is not trading advice, coinmarketbuzz.com holds no liability for any investments made based on the information provided on this page. We strongly recommend independent research and/or consultation with a qualified professional before making any investment decisions.
All published reports are reviewed by our editorial team for factual consistency, neutrality, and reader clarity.