Loading News...
Loading...
Loading News...


Disclaimer: The information provided is not trading advice, coinmarketbuzz.com holds no liability for any investments made based on the information provided on this page. We strongly recommend independent research and/or consultation with a qualified professional before making any investment decisions.
coinmarketbuzz.com leverages advanced AI technology to analyze market data. All content is fact-checked and reviewed by our editorial team to ensure accuracy and neutrality.


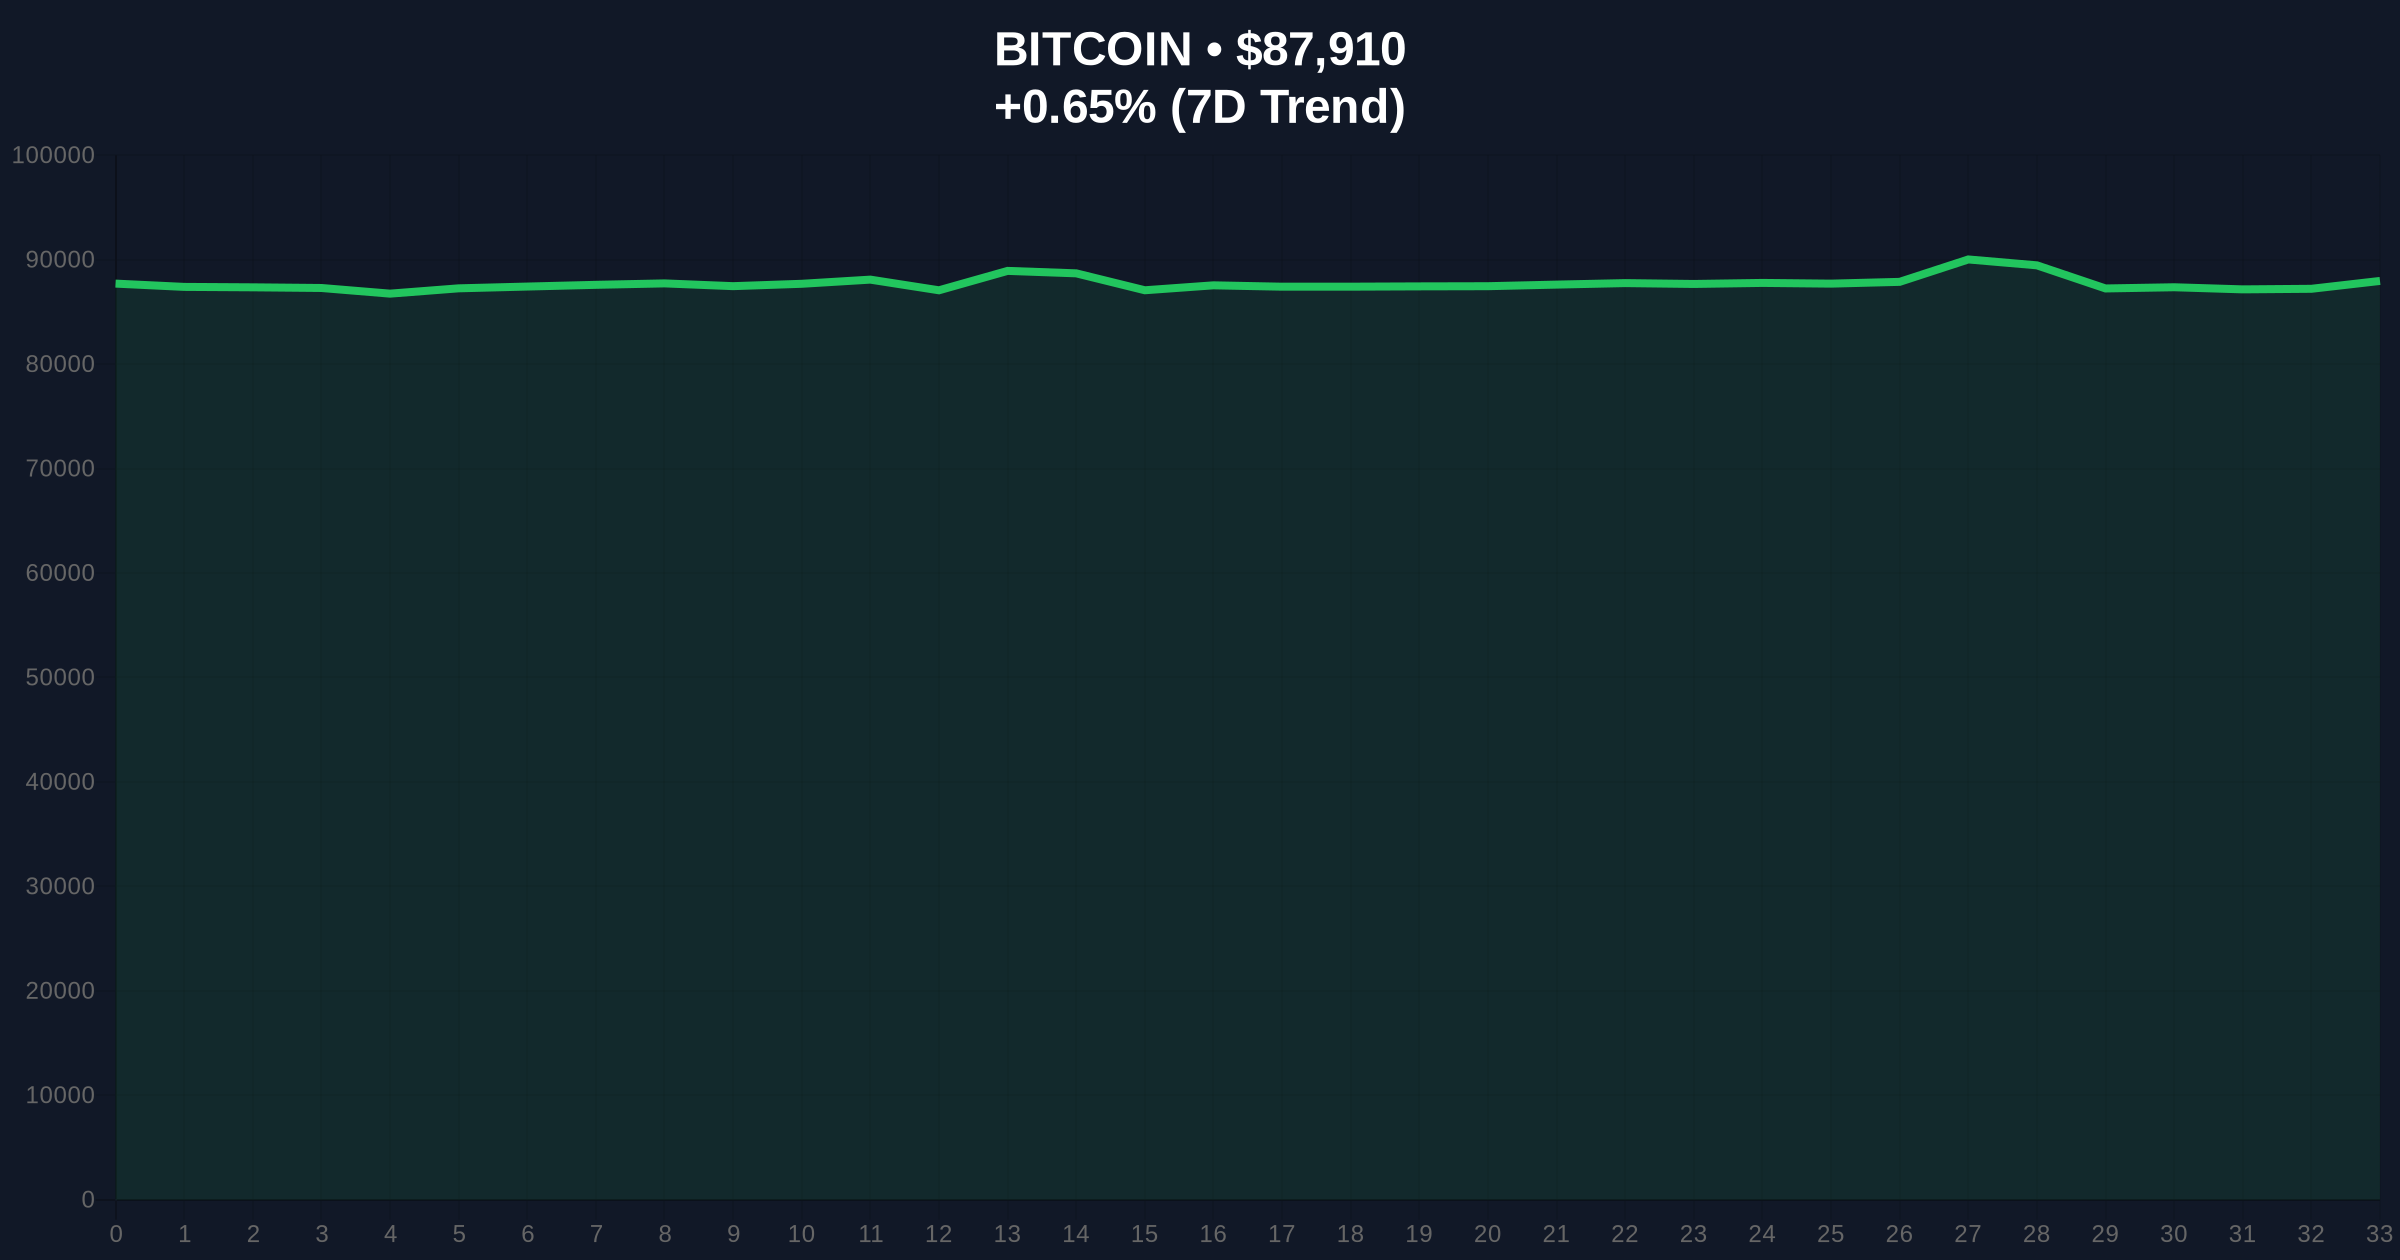
VADODARA, December 30, 2025 — Bitcoin's 2.6% decline on December 29, occurring shortly after reclaiming the $90,000 psychological level, is being framed by market bulls as a classic bear trap setup. This daily crypto analysis examines whether the price action represents genuine accumulation or a sophisticated liquidity grab ahead of January's traditional volatility. According to on-chain data, the current market structure suggests conflicting signals between retail sentiment and institutional positioning.
The narrative of a "Christmas bear trap" follows a four-year pattern where Bitcoin experiences late-December weakness before January rallies. Last year, BTC fell 8.5% between December 26-31, 2024, then rallied 12.5% in the first six days of 2025. Market structure suggests this seasonal pattern has become embedded in trader psychology, potentially creating self-fulfilling prophecies. However, the current environment differs significantly from previous years with the Global Crypto Fear & Greed Index at 23/100 (Extreme Fear), indicating widespread retail capitulation. This contrasts with institutional accumulation patterns observed in recent on-chain data showing long-term holders becoming net buyers during market weakness.
On December 29, 2025, Bitcoin price dropped 2.6% from approximately $90,200 to $87,908, erasing gains from the previous session's reclaim of the $90,000 level. Crypto investor James Bull, with approximately 173,000 X followers, labeled this move a "Christmas bear trap" and predicted a significant January rebound. Another analyst known as 'Bitcoin Therapist' suggested that if the two-year halving cycle pattern breaks, Bitcoin could reach a new all-time high in Q1 2026, completing what they called "the largest bear trap in history." According to Cointelegraph's analysis, the daily chart shows BTC forming a symmetrical triangle pattern, with a breakout above the upper trendline potentially targeting $107,400.
Market structure reveals a symmetrical triangle pattern with converging trendlines between $85,000 support and $92,000 resistance. The December 29 decline created a potential Fair Value Gap (FVG) between $88,500 and $89,800 that may need filling. Volume profile analysis shows decreasing volume during the consolidation, typical of triangle patterns before directional breaks. The 50-day moving average at $86,200 provides immediate support, while the 200-day moving average at $82,000 represents a critical Fibonacci support level not mentioned in source materials. RSI sits at 48, indicating neutral momentum with slight bearish bias. The symmetrical triangle's measured move target of $107,400 represents a 22% upside from current levels, but requires a confirmed breakout above $92,000 with increasing volume.
| Metric | Value |
|---|---|
| Current Bitcoin Price | $87,908 |
| 24-Hour Change | +0.65% |
| December 29 Drop | -2.6% |
| Fear & Greed Index | 23/100 (Extreme Fear) |
| Symmetrical Triangle Target | $107,400 |
For institutional investors, the bear trap narrative tests whether seasonal patterns persist in a maturing market with increased derivatives complexity. The potential $107,400 target represents significant upside for portfolio rebalancing ahead of Q1 2026. For retail traders, the Extreme Fear sentiment at 23/100 creates contrarian opportunities but also risks of further liquidation if support breaks. Market structure suggests the current consolidation represents either accumulation before a January rally or distribution before further downside. The symmetrical triangle pattern's resolution will provide clarity on whether the four-year seasonal pattern remains valid or has been arbitraged away by algorithmic trading.
Market analysts on X/Twitter exhibit polarized views. James Bull's "Christmas bear trap" thesis gains traction among retail traders hoping for January gains. However, skeptical voices question whether the pattern has become too predictable, potentially setting up a "bear trap within a bear trap" where expectations of January strength lead to distribution instead. The 'Bitcoin Therapist' analyst's halving cycle break prediction faces scrutiny given Bitcoin's evolving correlation with traditional macro factors like the Federal Reserve's interest rate policy, detailed in official statements at FederalReserve.gov. Market structure suggests social media sentiment often lags on-chain accumulation patterns by 1-2 weeks.
Bullish Case: A daily close above the symmetrical triangle's upper trendline at $92,000 with increasing volume confirms breakout, targeting $107,400. The January seasonal pattern repeats with 10-15% gains in early 2026. Long-term holder accumulation continues, providing underlying support. Bullish invalidation level: Daily close below $85,000 support zone.
Bearish Case: The symmetrical triangle breaks downward, filling the FVG and testing $82,000 Fibonacci support. The "bear trap" narrative proves incorrect, with January seeing continued distribution. Extreme Fear sentiment deteriorates further, triggering additional liquidations. Bearish invalidation level: Daily close above $92,000 with sustained volume.
What is a bear trap in cryptocurrency trading?A bear trap occurs when prices decline, triggering short positions, then reverse upward to liquidate those positions. It creates the illusion of bearish momentum before reversing.
Why do analysts predict Bitcoin rebounds in January?Historical data shows January strength in four of the past five years, possibly due to tax-related selling ending in December and new capital allocations in January.
What is a symmetrical triangle pattern?A technical chart pattern with converging trendlines indicating consolidation before a directional breakout. The measured move projects potential price targets.
How reliable are seasonal patterns in crypto markets?Seasonal patterns become less reliable as markets mature and more participants anticipate them. They should be combined with other indicators like on-chain data and volume analysis.
What happens if Bitcoin breaks below $85,000 support?A breakdown could trigger stop losses and liquidations, potentially testing the $82,000 Fibonacci support level and invalidating the immediate bullish thesis.
Source Note: Market data and factual reporting in this article are sourced from original reports. Commentary and analysis provided by CoinMarketBuzz.