Loading News...
Loading...
Loading News...

VADODARA, January 27, 2026 — The Ethereum ecosystem faces a severe liquidity contraction as its stablecoin market capitalization collapses by $7 billion in seven days. According to on-chain data aggregated by CryptoPotato, this rapid decline mirrors patterns observed during Bitcoin's 2021 bear market. Market structure suggests shrinking stablecoin supply typically precedes prolonged price deterioration. Consequently, analysts now scrutinize exchange reserves and macroeconomic headwinds for further signals.
Crypto analyst Darkfost first identified the stablecoin outflow through Ethereum blockchain analytics. The $7 billion reduction represents one of the steepest weekly declines since the 2022 Terra collapse. Exchange data corroborates the trend. Approximately $6 billion in assets exited Binance last week. This simultaneous withdrawal creates a pronounced liquidity vacuum. Market pressure intensifies as Bitcoin trades below $88,000. The Federal Reserve's ongoing quantitative tightening further strains capital availability. This daily crypto analysis reveals a classic liquidity grab scenario.
Historically, stablecoin market cap contractions signal bearish inflection points. A similar pattern emerged during Bitcoin's 2021 downturn. That cycle saw a $15 billion stablecoin reduction precede a 50% price correction. In contrast, the 2023 rally coincided with stablecoin supply expansion. Underlying this trend is a simple mechanic. Stablecoins act as primary on-chain liquidity. Their reduction limits buying power for assets like ETH. Consequently, price discovery becomes skewed to the downside. The current $7 billion drop represents a 5.2% weekly contraction. This velocity exceeds the 2021 precedent.
Related developments this week include Binance's margin pair delistings and shifting US Bitcoin ETF flows. These events collectively point to institutional repositioning.
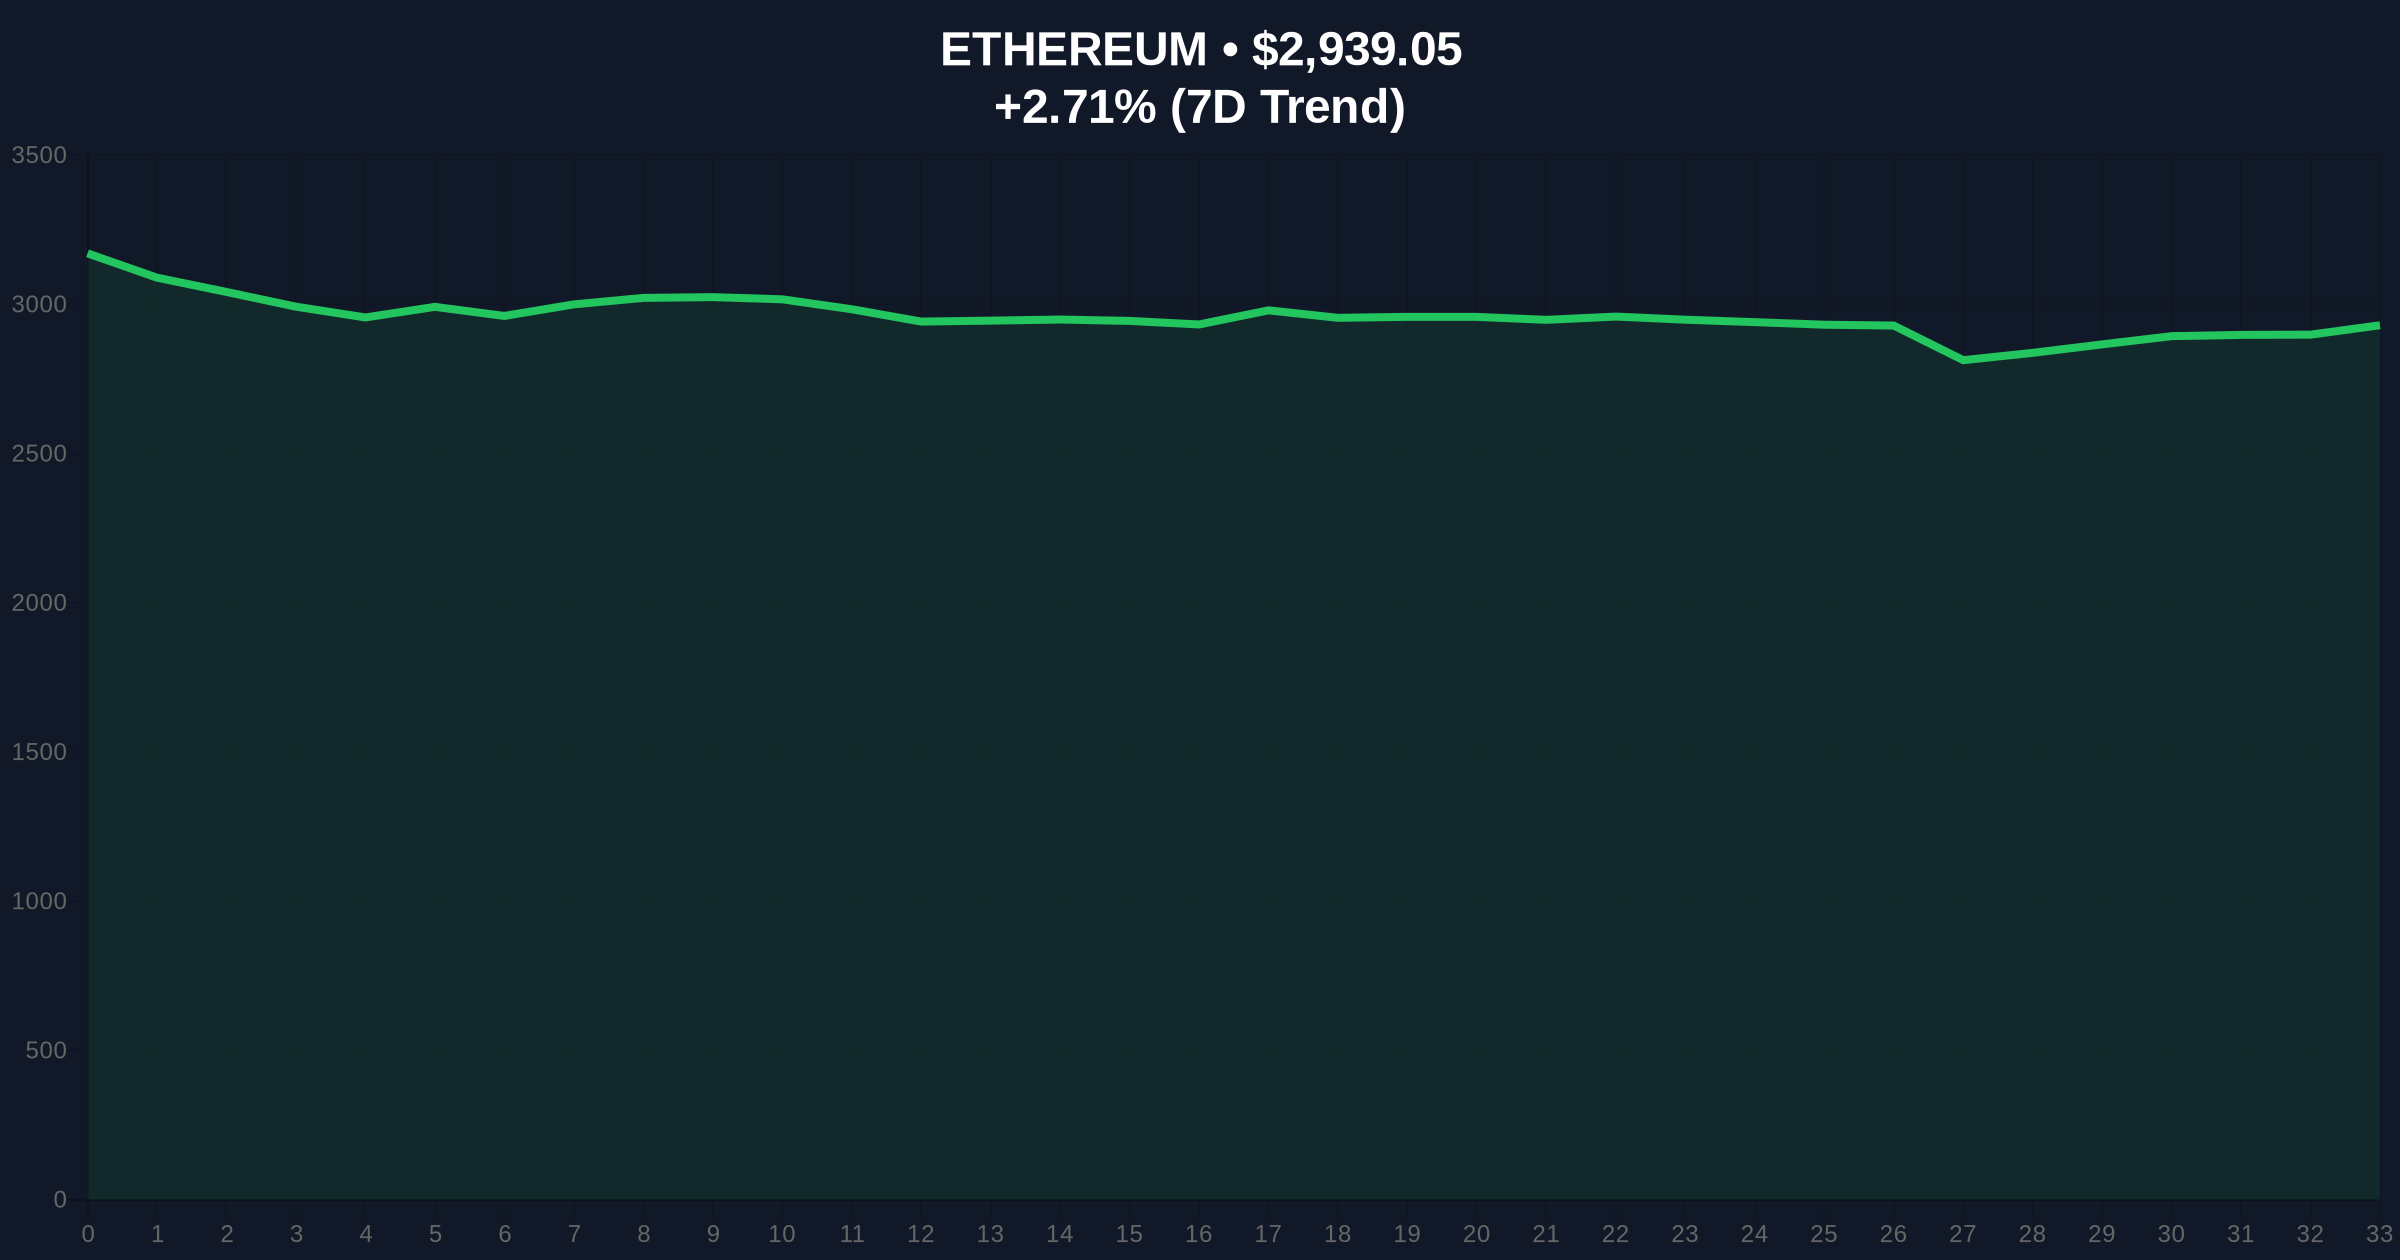
Ethereum's price action now tests critical technical levels. The $2,939 spot price sits near the 50-day moving average. A key Fibonacci retracement level at $2,850 (0.618 of the 2025 rally) provides immediate support. This level aligns with a high-volume node on the ETH volume profile. Market structure suggests a break below $2,850 would open a Fair Value Gap (FVG) toward $2,650. The Relative Strength Index (RSI) currently prints at 42, indicating neutral momentum. However, declining stablecoin supply often precedes RSI breakdowns. On-chain metrics like Net Unrealized Profit/Loss (NUPL) also show profit-taking acceleration.
| Metric | Value | Implication |
|---|---|---|
| Stablecoin Cap Decline | $7B (1 week) | Bearish liquidity signal |
| Binance Net Outflow | $6B (1 week) | Institutional risk-off |
| ETH Current Price | $2,939.24 | Testing 50-day MA |
| ETH 24h Trend | +2.72% | Short-term relief bounce |
| Crypto Fear & Greed Index | 29/100 (Fear) | Extreme caution sentiment |
Stablecoin supply serves as the lifeblood of decentralized finance (DeFi). A contraction directly impacts lending protocols like Aave and Compound. Lower stablecoin availability increases borrowing rates. This can trigger cascading liquidations. , reduced liquidity amplifies price slippage on decentralized exchanges. Institutional players monitor these metrics for entry timing. The current decline suggests large holders are de-risking. Historical cycles indicate such outflows often precede multi-month consolidations. For retail traders, this environment demands heightened risk management.
"The $7 billion stablecoin withdrawal creates a pronounced liquidity vacuum. When combined with Federal Reserve balance sheet reduction, it forms a macro-liquidity double squeeze. Markets typically require 6-8 weeks to absorb such shocks," stated the CoinMarketBuzz Intelligence Desk.
Two primary technical scenarios emerge from current data. Scenario A assumes the $2,850 support holds. This would allow ETH to consolidate and rebuild liquidity through EIP-4844 blob fee reductions. Scenario B involves a breakdown below $2,850. That would target the next volume gap at $2,650. Institutional outlook remains cautious for Q1 2026.
The 12-month outlook hinges on stablecoin reflation. Historical data from the Federal Reserve's H.4.1 report shows that liquidity cycles typically last 2-3 quarters. If stablecoin supply recovers by Q2 2026, ETH could retest all-time highs. Otherwise, prolonged consolidation seems likely.

Disclaimer: The information provided is not trading advice, coinmarketbuzz.com holds no liability for any investments made based on the information provided on this page. We strongly recommend independent research and/or consultation with a qualified professional before making any investment decisions.
coinmarketbuzz.com leverages advanced AI technology to analyze market data. All content is fact-checked and reviewed by our editorial team to ensure accuracy and neutrality.