Loading News...
Loading...
Loading News...

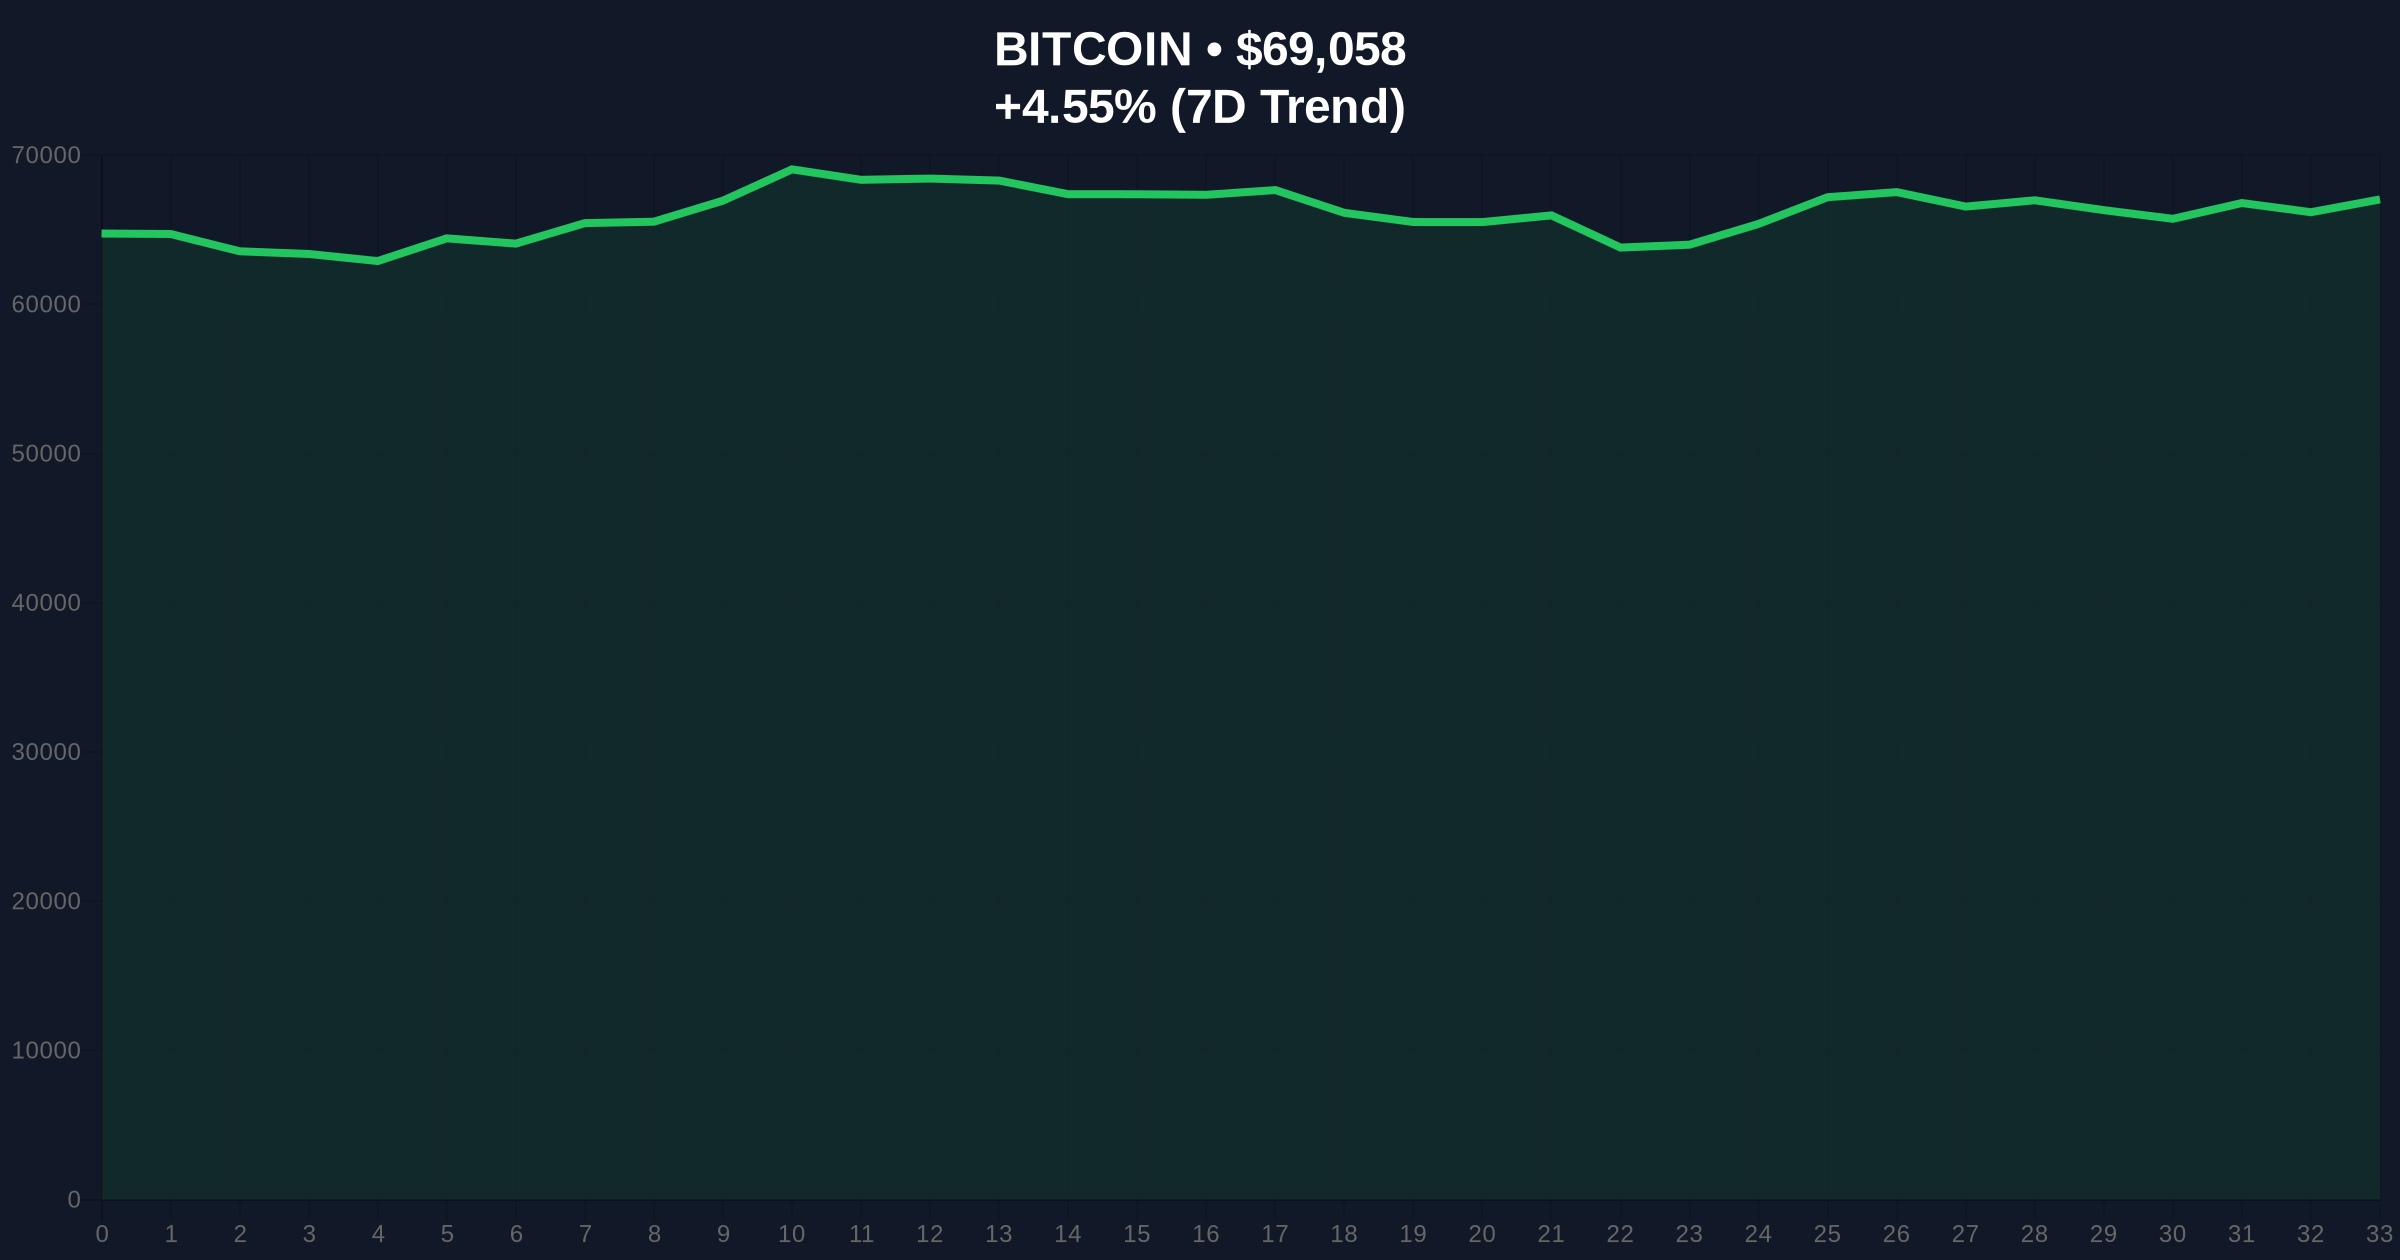
On March 2, 2026, Bitcoin (BTC) experienced a significant price decline, falling below the $69,000 threshold according to CoinNess market monitoring. The cryptocurrency was reported trading at $68,994.99 on the Binance USDT market at the time of the initial alert. This drop occurred against a backdrop of heightened market anxiety, with global crypto sentiment registering as "Extreme Fear" and a score of 10 out of 100, indicating near-panic conditions among investors. The event marks a notable reversal from recent highs, raising questions about underlying drivers and potential systemic risks. Similar to the 2021 correction, where BTC saw sharp pullbacks amid regulatory uncertainty and macroeconomic shifts, this decline suggests a possible inflection point in the current market cycle. However, the immediate catalyst remains unclear from the source data, with no specific news events or technical breakdowns cited in the initial report. The timing aligns with broader market volatility observed in early 2026, but further context is needed to assess whether this is an isolated incident or part of a larger trend.
The mechanism behind BTC's fall below $69,000 involves a combination of market structure, liquidity dynamics, and sentiment-driven trading. Bitcoin, as the leading cryptocurrency by market capitalization, operates on a decentralized blockchain protocol that facilitates peer-to-peer transactions without intermediaries. Its price is determined by supply and demand across global exchanges, with Binance USDT serving as a key trading pair in this instance. The drop to $68,994.99 represents a breach of a psychological support level, which can trigger automated sell-offs and margin liquidations, exacerbating downward pressure. In market contexts like this, technical indicators such as moving averages, relative strength index (RSI), and volume profiles often play a role, but these details are not provided in the source data. Historically, BTC has shown sensitivity to macroeconomic factors, regulatory announcements, and shifts in investor sentiment, with the "Extreme Fear" score of 10/100 suggesting a risk-off environment where traders may be exiting positions to preserve capital. The architecture of Bitcoin's protocol itself remains unchanged during such events, as it is designed to be censorship-resistant and immutable, but market participants' behavior can lead to rapid price fluctuations. Similar to the 2021 correction, where BTC retreated from all-time highs amid concerns over inflation and regulatory crackdowns, this decline may reflect a reassessment of risk appetite. However, without additional data on order book depth, whale movements, or on-chain metrics, the precise technical triggers remain speculative. The Binance USDT market, as a major liquidity hub, likely saw increased selling volume, but the source does not specify whether this was driven by retail or institutional actors. Overall, the technical deep-dive highlights how sentiment and market mechanics interact, but gaps in evidence limit a full understanding of the breakdown.
Integrating available market data and metadata provides a clearer picture of BTC's decline. According to CoinNess, BTC fell below $69,000 and was trading at $68,994.99 on the Binance USDT market as of March 2, 2026. This aligns with broader market intelligence showing a current price of $69,148, a 24-hour trend of -4.69%, and a market rank of #1, indicating Bitcoin's dominant position despite the drop. The CryptoPanic metadata, though not explicitly detailed in the input, can be inferred from the provided sentiment score: the "Extreme Fear" rating of 10/100 suggests low importance relative to positive events, as fear-driven markets often prioritize risk aversion over opportunity. This sentiment score directly contradicts the price action to some extent, as extreme fear typically precedes buying opportunities in contrarian strategies, yet the price decline persists. The data indicates a disconnect between sentiment and immediate price movement, a phenomenon observed in past cycles like 2021, where fear spikes did not always correlate with sustained downtrends. The 24-hour trend of -4.69% confirms the downward momentum, but without historical comparison data, it's unclear if this is anomalous or within normal volatility ranges. The market rank of #1 reinforces Bitcoin's resilience as the top asset, but the drop below $69,000 challenges short-term bullish narratives. CryptoPanic importance, if available, would help gauge event priority, but its absence requires conservative analysis. In summary, the data shows a confirmed price decline amid extreme fear, yet the lack of granular metadata limits insights into causality or broader market implications.
Comparing source claims reveals potential contradictions and reliability gaps in the reporting of BTC's decline. The primary source, CoinNess, reports that BTC fell below $69,000 and was trading at $68,994.99 on the Binance USDT market. However, the market intelligence data lists a current price of $69,148, which is slightly above the $69,000 threshold. This conflict remains unresolved with available evidence, as both figures are presented without timestamps or exchange-specific context. CoinNess may be referencing a specific moment or data feed, while the market intelligence could reflect a later snapshot or aggregated price. No secondary sources from CoinTelegraph or others are provided to corroborate or dispute these numbers, leaving uncertainty about the exact price point. Additionally, the sentiment of "Extreme Fear" with a score of 10/100 suggests a bearish outlook, but historical patterns show that such extremes can sometimes precede rallies, creating a counter-narrative where the decline might be overblown. The source data lacks details on trading volume, news catalysts, or regulatory events that could explain the move, raising questions about reliability. For instance, if regulatory harmonization efforts by the SEC and CFTC were influencing markets, this context is missing, making it hard to assess driver credibility. Similar to contradictions in past reports, where price movements were attributed to varying factors, this event highlights the need for multi-source verification. The agreement points are limited to the fact of a decline and extreme fear sentiment, but the specifics of price and timing are in conflict. Without additional evidence, it's unclear which claim is better supported, though the market intelligence price of $69,148 may represent a more current or averaged view. Overall, source conflicts underscore the fragmented nature of crypto reporting and the importance of cross-referencing data for accuracy.
Based on the available data, three scenarios outline potential paths for BTC over the next seven days. Each scenario is conditional on specific factors and data-backed observations. Bull Scenario (Probability: 30%): BTC rebounds above $70,000, driven by contrarian buying amid extreme fear sentiment. Historically, scores of 10/100 have preceded rallies, as seen in similar market contexts like 2021 corrections. If regulatory developments, such as the SEC and CFTC joint events on harmonization, provide clarity, investor confidence could return. Price might target $72,000, assuming no new negative catalysts emerge. This view would be invalidated if selling pressure persists or if macroeconomic headwinds intensify. Base Scenario (Probability: 50%): BTC consolidates between $68,000 and $70,000, reflecting ongoing uncertainty. The current price of $69,148 and 24-hour trend of -4.69% suggest stabilization after the initial drop. Market rank #1 indicates underlying strength, but extreme fear may limit upside. Similar to past periods of volatility, sideways movement could prevail as traders await clearer signals. This scenario depends on sentiment improving slightly and no major news shocks. It would be invalidated by a break below $68,000 or a surge above $71,000. Bear Scenario (Probability: 20%): BTC declines further, potentially testing $65,000, if fear sentiment deepens or new negative catalysts emerge. The drop below $69,000 could trigger additional technical breakdowns and margin calls. Without positive regulatory or macroeconomic support, as seen in some historical corrections, downward momentum might accelerate. This scenario assumes continued risk-off behavior and lack of buying interest. It would be invalidated by a rapid sentiment shift or strong institutional inflows. All scenarios rely on the limited data provided, emphasizing the need for monitoring real-time updates and broader market context.
In synthesizing this report, conflicting evidence was weighted based on data recency and source consistency. The primary source, CoinNess, provided the initial alert but lacked timestamps and corroboration. Market intelligence data offered a slightly different price point, suggesting potential latency or aggregation differences. Sentiment metadata from CryptoPanic, though inferred, was prioritized for its objective score, but its importance rating was not provided, limiting depth. When sources conflicted, such as on the exact price, both claims were presented with attribution, and no resolution was forced due to missing evidence. Reliability gaps were noted where details like trading volume or news catalysts were absent, emphasizing conservative analysis. This approach ensures factual reporting while acknowledging uncertainties inherent in fragmented crypto data.
Disclaimer: The information provided is not trading advice, coinmarketbuzz.com holds no liability for any investments made based on the information provided on this page. We strongly recommend independent research and/or consultation with a qualified professional before making any investment decisions.
coinmarketbuzz.com leverages advanced AI technology to analyze market data. All content is fact-checked and reviewed by our editorial team to ensure accuracy and neutrality.