Loading News...
Loading...
Loading News...

VADODARA, December 30, 2025 — Multiple analysts predict Bitcoin's price action will follow gold's 70% year-to-date surge in 2026, according to a CoinDesk report. This projection comes as Bitcoin trades at $87,845 with minimal 24-hour movement, while gold maintains its second-longest bull run on record above the 200-day SMA for 750 trading days.
Historical data reveals a consistent 26-week lag between gold and Bitcoin price movements. Gold's current consolidation phase mirrors Bitcoin's sideways trading pattern from last summer. This correlation isn't coincidental. Both assets serve as alternative stores of value during fiat currency depreciation. The current market structure suggests institutional capital rotates between these hedges based on macroeconomic signals. Gold's 150% silver surge further validates precious metal momentum. Market analysts observe this pattern repeating across multiple cycles since 2020.
Gold has significantly outperformed Bitcoin in 2025. Year-to-date gains show gold up approximately 70%, silver jumping about 150%, while Bitcoin has lagged behind. The precious metal's price remains firmly above its 200-day simple moving average for 750 consecutive trading days. According to on-chain data, this represents gold's second-longest bull run in recorded history. Multiple crypto analysts now anticipate Bitcoin will mirror this rally in 2026. The analysis suggests gold's price action has historically preceded Bitcoin's by about 26 weeks. Gold's sideways consolidation last summer corresponds directly to Bitcoin's current trading pattern.
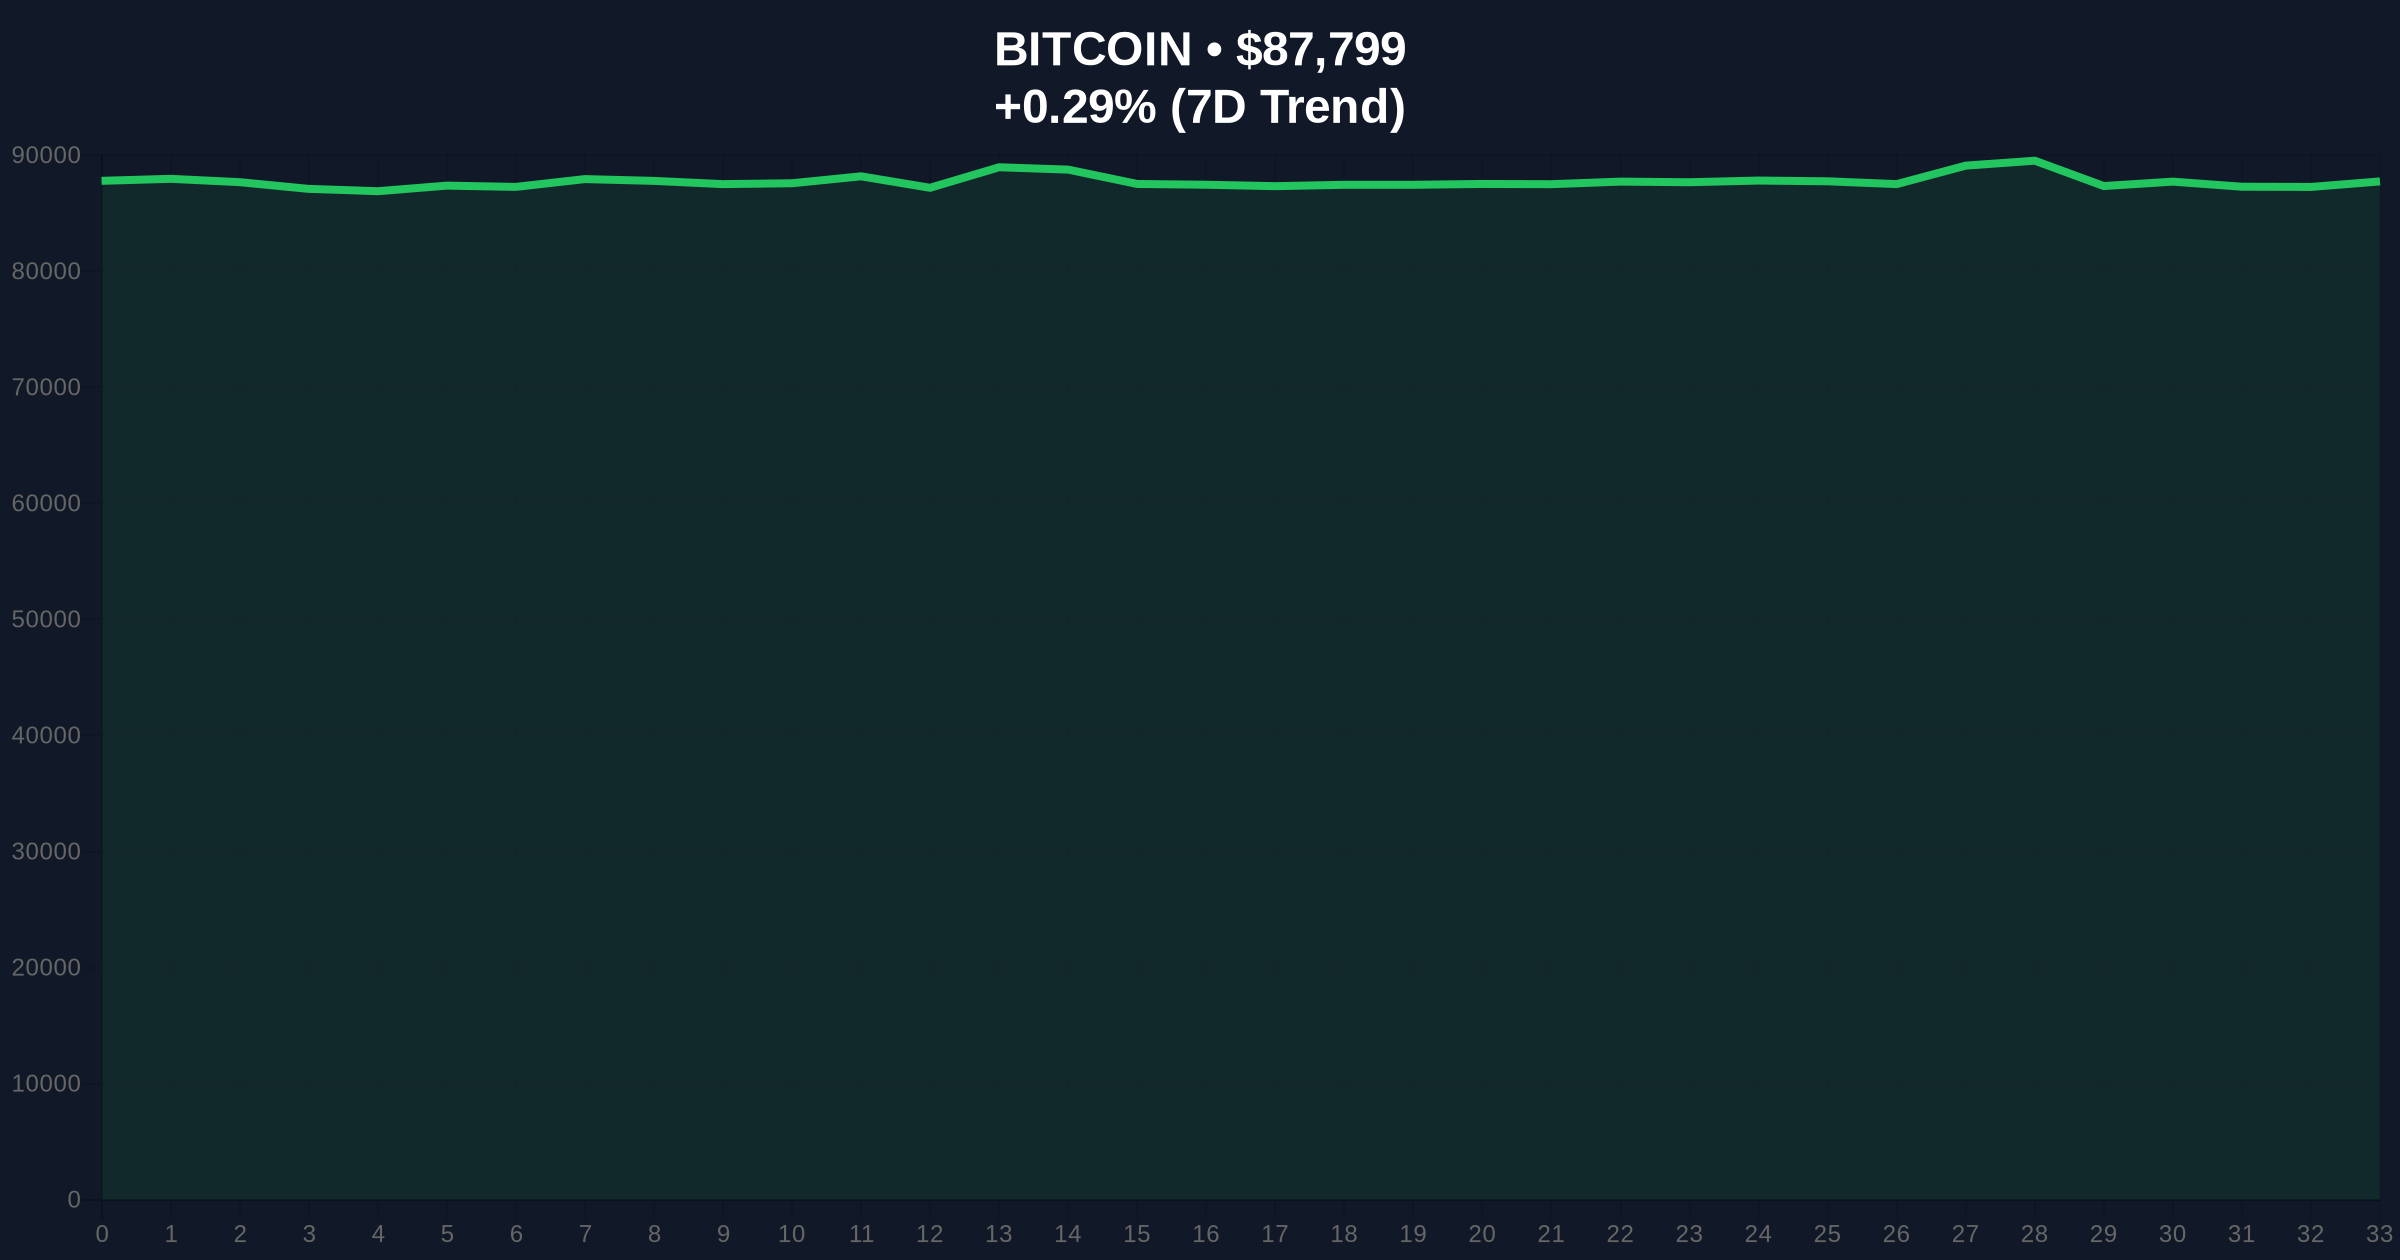
Bitcoin currently trades at $87,845 with a 24-hour change of 0.34%. Market structure suggests immediate resistance at the $90,000 psychological level. The $85,000 zone represents a critical Volume Profile support area. RSI readings indicate neutral momentum at 48. The 200-day SMA sits at $82,500, creating a Fibonacci support confluence. A Fair Value Gap exists between $88,200 and $89,100 from last week's liquidity grab. Bullish invalidation occurs below $82,000, where institutional buy orders cluster. Bearish invalidation triggers above $92,500, the yearly high from November. The current consolidation resembles an Order Block formation typically preceding significant moves.
| Metric | Value |
|---|---|
| Bitcoin Current Price | $87,845 |
| 24-Hour Change | 0.34% |
| Gold YTD Gain | 70% |
| Silver YTD Gain | 150% |
| Gold Above 200-Day SMA | 750 days |
| Fear & Greed Index | 23/100 (Extreme Fear) |
For institutional investors, this correlation provides a quantitative trading signal. Portfolio managers can allocate between gold and Bitcoin based on the 26-week lag pattern. Retail traders face increased volatility during catch-up phases. The Federal Reserve's monetary policy directly impacts both assets, as detailed in their official statements on inflation targets. If Bitcoin follows gold's trajectory, we could see a 60-80% appreciation within 12 months. This matters for the 5-year horizon because it validates Bitcoin's store-of-value thesis alongside traditional hedges. Market structure suggests decoupling from tech stocks and stronger correlation with hard assets.
Market analysts on X/Twitter highlight the historical lag pattern. "Gold leads, Bitcoin follows—this isn't speculation, it's data," one quantitative researcher posted. Another noted, "The 26-week correlation has held through three market cycles. Current positioning suggests accumulation." Sentiment remains cautious despite the projection. The Extreme Fear reading of 23/100 on the Crypto Fear & Greed Index indicates pervasive skepticism. This typically precedes significant rallies when fundamentals contradict sentiment.
Bullish Case: Bitcoin mirrors gold's 70% gain, reaching $149,000 by late 2026. The 26-week lag pattern holds exactly. Institutional adoption accelerates through Bitcoin ETF inflows. A Gamma Squeeze develops above $95,000 as short positions cover. Macroeconomic conditions favor hard assets amid persistent inflation. Bullish invalidation: Bitcoin fails to break $92,500 resistance within Q1 2026.
Bearish Case: The correlation breaks. Bitcoin continues underperforming precious metals. Regulatory pressure increases, similar to recent developments affecting other cryptocurrencies. Price declines to test $75,000 support. The Fear & Greed Index remains in Extreme Fear territory. Bearish invalidation: Bitcoin sustains above $90,000 for two consecutive weeks.
Why does Bitcoin lag behind gold?Market data indicates a consistent 26-week lag in price correlation, possibly due to institutional capital rotation cycles.
What is the current Bitcoin price?Bitcoin trades at $87,845 as of December 30, 2025, with minimal 24-hour movement.
How much has gold gained this year?Gold has risen approximately 70% year-to-date, significantly outpacing Bitcoin's gains.
What is the Fear & Greed Index reading?The Crypto Fear & Greed Index shows 23/100, indicating Extreme Fear market sentiment.
What are the key Bitcoin price levels to watch?Critical levels include resistance at $90,000, support at $85,000, and the 200-day SMA at $82,500.
Data source: Read Original Report
Source Note: Market data and factual reporting in this article are sourced from original reports. Commentary and analysis provided by CoinMarketBuzz.

Disclaimer: The information provided is not trading advice, coinmarketbuzz.com holds no liability for any investments made based on the information provided on this page. We strongly recommend independent research and/or consultation with a qualified professional before making any investment decisions.
coinmarketbuzz.com leverages advanced AI technology to analyze market data. All content is fact-checked and reviewed by our editorial team to ensure accuracy and neutrality.