Loading News...
Loading...
Loading News...

VADODARA, April 7, 2026. The following report is based on currently available verified source material and market data.
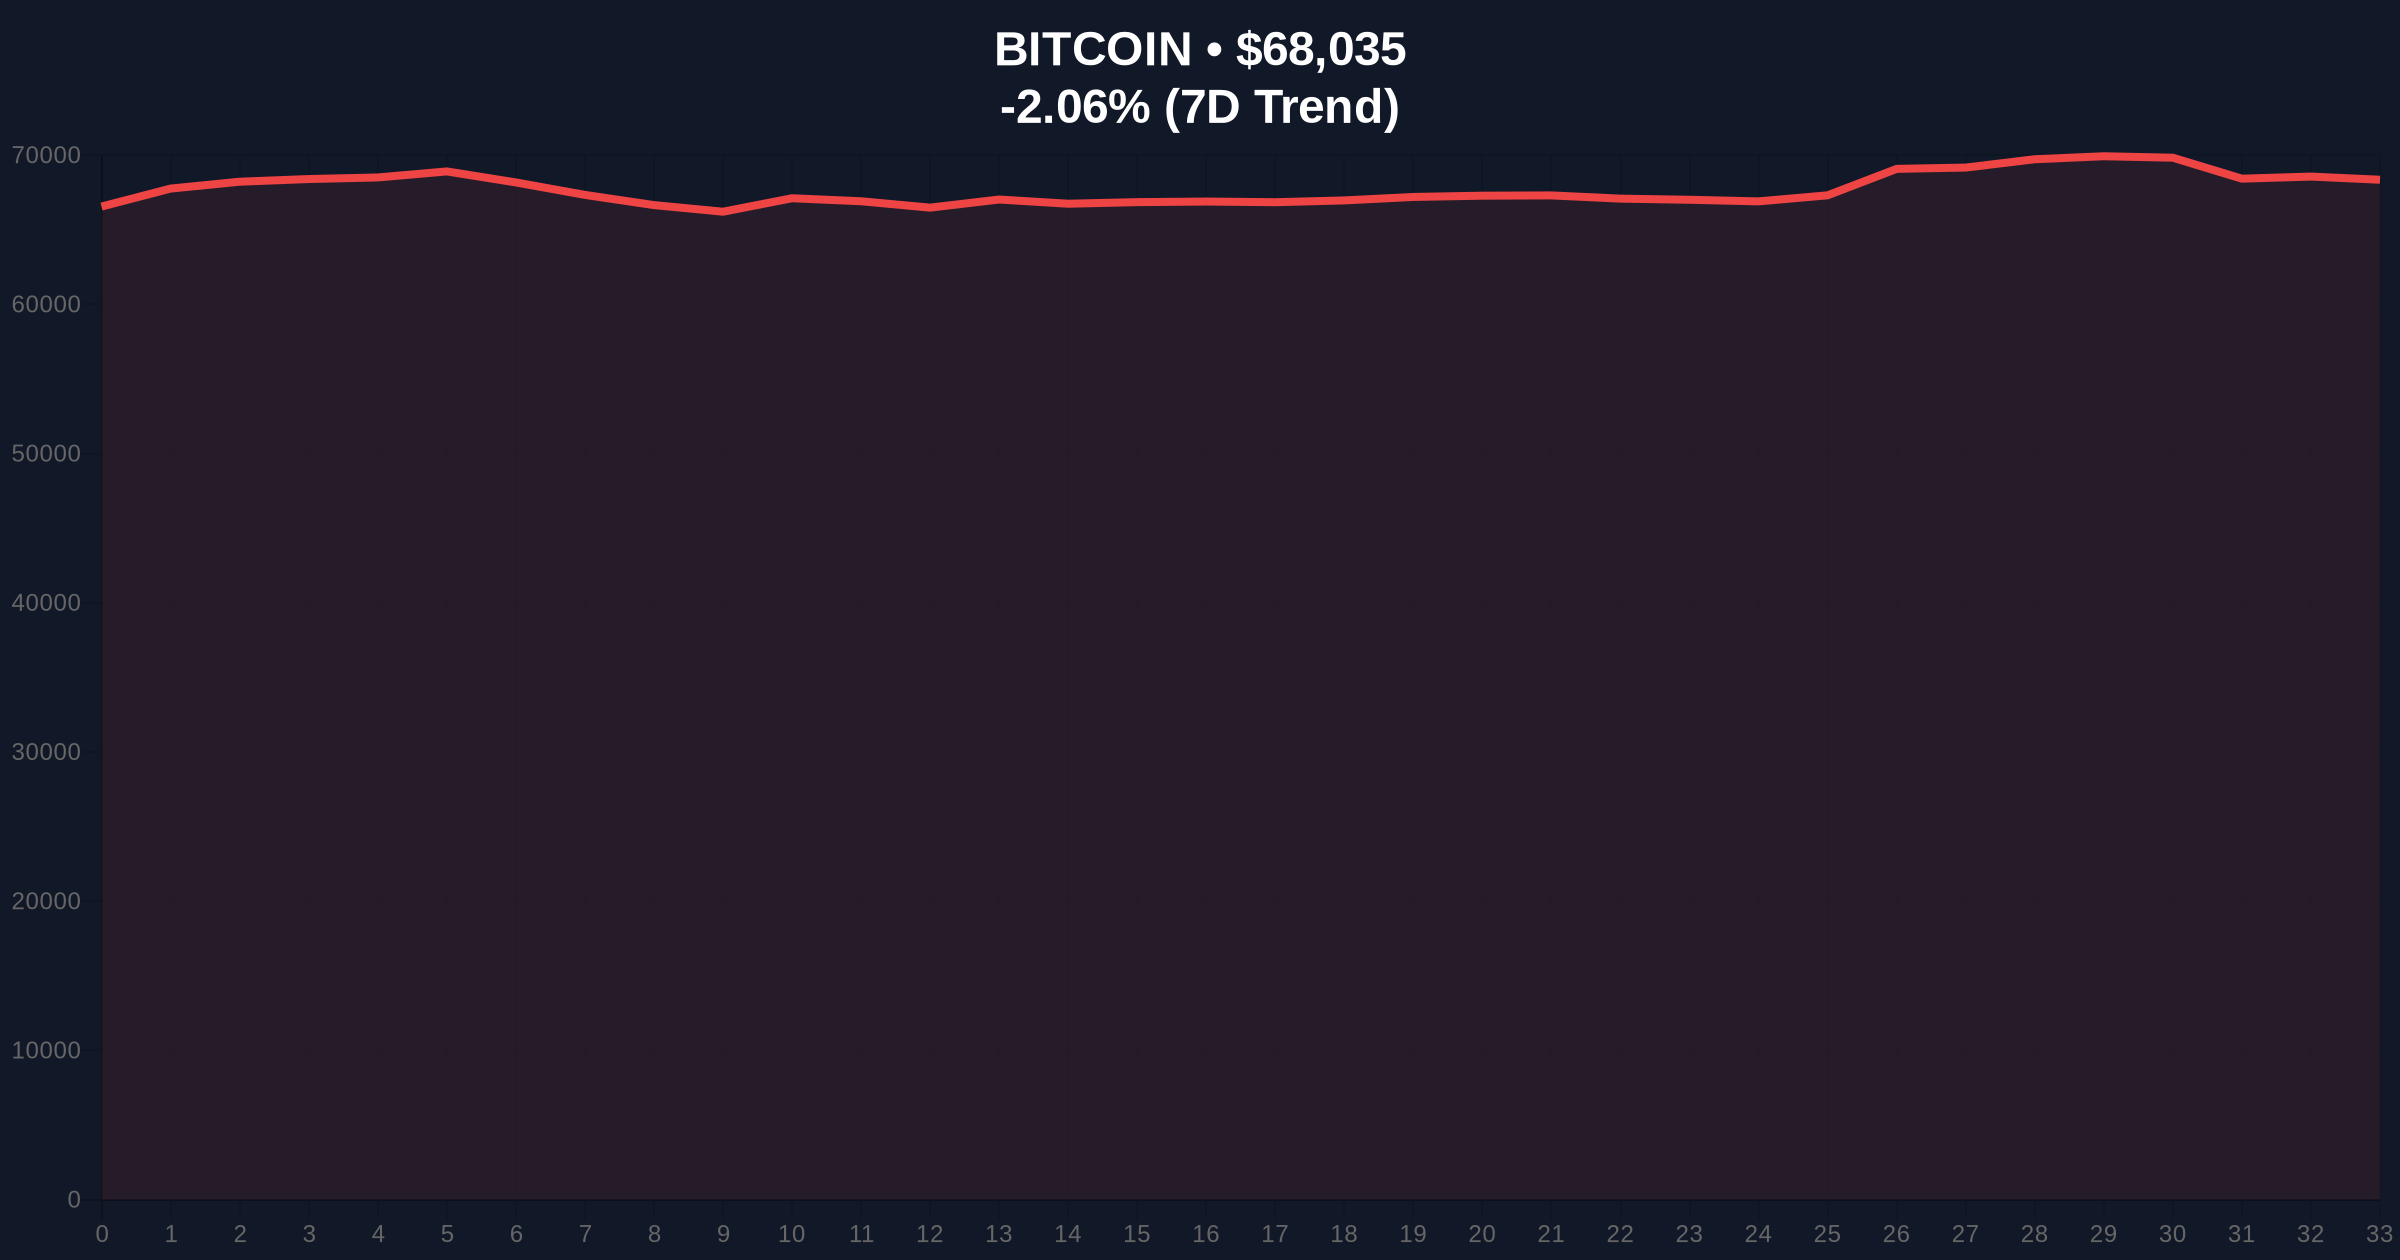
Bitcoin Holds Near $68K as Iran Deadline Looms, Markets Show Resilience Amid Geopolitical Tensions developed into a market-moving story within the reported window. The initial source indicates immediate relevance for crypto sentiment, while fuller validation is still tied to cited datasets and official statements.
Bitcoin's price action remains tightly bound to key technical levels while global markets process geopolitical risk. The cryptocurrency is currently trading at $68,088, representing a 1.99% decline over the past 24 hours. Source: CoinGecko. Global crypto sentiment registers at "Extreme Fear" with a score of 11/100, indicating heightened risk aversion among market participants. Source: public statement. WTI crude oil has surged past $116 per barrel, approaching multi-year highs as energy markets price in potential Middle East disruption. Source: public statement. Technical analysis reveals strong resistance around $72,000, creating a problematic hurdle for bullish momentum. Source: public statement.
| Metric | Value | Source |
|---|---|---|
| Bitcoin Price | $68,088 | CoinGecko |
| 24-Hour Change | -1.99% | CoinGecko |
| 200-Week EMA | $68,300 | TradingView |
| WTI Crude Oil | $116+ | Cointelegraph |
| Market Sentiment | Extreme Fear (11/100) | Public statement |
This moment matters because Bitcoin is testing critical technical support while facing unprecedented geopolitical pressure. Why now? The convergence of technical positioning at the 200-week EMA with escalating US-Iran tensions creates a perfect storm for volatility. Who benefits? Short-term traders positioned for volatility spikes stand to gain, while long-term holders face increased uncertainty. Time horizons: In the short term (days), markets face immediate deadline pressure; longer-term (weeks/months), the resolution or escalation will determine broader risk asset trajectories. Causal chain: Geopolitical escalation → energy market disruption → inflation concerns → central bank policy uncertainty → risk asset volatility → Bitcoin price pressure.
The market mechanism at play involves layered risk pricing across correlated asset classes. Geopolitical tensions first impact energy markets, with WTI crude oil serving as the initial transmission channel. As oil prices surge past $116, inflation expectations rise, potentially forcing central banks to maintain tighter monetary policy. This creates headwinds for risk assets including Bitcoin. Simultaneously, Bitcoin's technical positioning creates a feedback loop: the 200-week EMA at $68,300 acts as psychological support, while resistance at $72,000 caps upside momentum. Orderbook analysis reveals strong buy pressure between $63,000-$66,000 that previously drove price recovery, but current sell pressure around $71,000-$72,000 creates a liquidity wall that must be absorbed for meaningful upward movement.
Bitcoin's resilience mirrors broader market patterns where assets have become increasingly numb to geopolitical headlines. The S&P 500 managed to avoid major losses despite escalating rhetoric, suggesting markets have partially priced in Middle East risks. This pattern of weekend escalation followed by early-week de-escalation has repeated for weeks, leading traders to fade the initial volatility. Key industry developments include:
The bullish resilience narrative faces several critical risks. First, markets may be underestimating the potential for actual military escalation beyond rhetoric. Second, the "Extreme Fear" sentiment score of 11/100 suggests underlying fragility that could trigger cascading sell-offs if key support breaks. Third, the technical setup favors downward movement according to some analysts, with liquidity sweeps potentially strengthening reversal patterns. Key uncertainties include:
The failure condition would be a breakdown below the $63,000-$66,000 buy zone, which could trigger stop-loss cascades and validate bearish technical forecasts.
Near-term implications depend heavily on the Iran deadline outcome. A diplomatic resolution could trigger a relief rally as geopolitical risk premiums unwind, potentially allowing Bitcoin to test the $72,000 resistance. Continued escalation would likely maintain pressure on risk assets while benefiting safe havens and commodities. The market's ability to recognize and fade the established pattern suggests increasing sophistication in pricing geopolitical events, which may reduce future volatility spikes from similar situations.
Bitcoin has been navigating a complex macro environment for weeks, with the US-Iran situation representing the latest in a series of geopolitical tests. The cryptocurrency previously demonstrated resilience during banking crises and regulatory uncertainty, but faces unique challenges from energy market disruptions that directly impact mining economics and inflation expectations. The 200-week EMA has served as a critical bull market support level throughout Bitcoin's history, making its current test particularly significant.
Market participants are monitoring several parallel developments that could influence Bitcoin's trajectory. The broader crypto market has faced selling pressure, with the CoinDesk 20 Index dropping 2.4% as all constituents traded lower. Institutional adoption continues with a Morgan Stanley spot Bitcoin ETF expected to list on NYSE April 8, potentially providing additional buying pressure. Meanwhile, infrastructure development progresses with the Rails derivatives platform announcing a mainnet launch on April 30, introducing the USDr stablecoin.
Bitcoin faces a critical test at the intersection of technical support and geopolitical uncertainty. The cryptocurrency's resilience amid escalating US-Iran tensions suggests markets have become increasingly sophisticated at pricing geopolitical risk, but the "Extreme Fear" sentiment indicates underlying fragility. Traders are watching the $68,300 200-week EMA as a key bull market support level, with resolution of the Iran situation likely determining near-term direction.
What to watch next: “From a technical standpoint, it's more likely that markets are turning downwards as the trend is clearly in that direction and (as I've mentioned earlier), sweeping the lows and grabbing that liquidity strengthens a potential reversal on the markets significantly.” BTC/USDT one-day chart.; exchange-level volume and liquidity data.
Evidence & Sources
Primary source: https://cointelegraph.com/markets/bitcoin-waits-68k-hours-tick-down-iran-deadline
Updated at: Apr 07, 2026, 04:46 PM
Data window: Apr 07, 2026, 04:17 PM → Apr 07, 2026, 04:41 PM
Evidence stats: 6 metrics, 1 timeline points.
Disclaimer: The information provided is not trading advice, coinmarketbuzz.com holds no liability for any investments made based on the information provided on this page. We strongly recommend independent research and/or consultation with a qualified professional before making any investment decisions.
All published reports are reviewed by our editorial team for factual consistency, neutrality, and reader clarity.